So far S&P 500 has increased by 7.49% YTD, and it has almost reached the 3 years high since financial melted down in 2008~2009. It can be very helpful to take a moment to raise our perspective to the price of SP500 and ask ourselves a simple question: is the current market over-valued? Let us take a look at what PE ratio tells us:
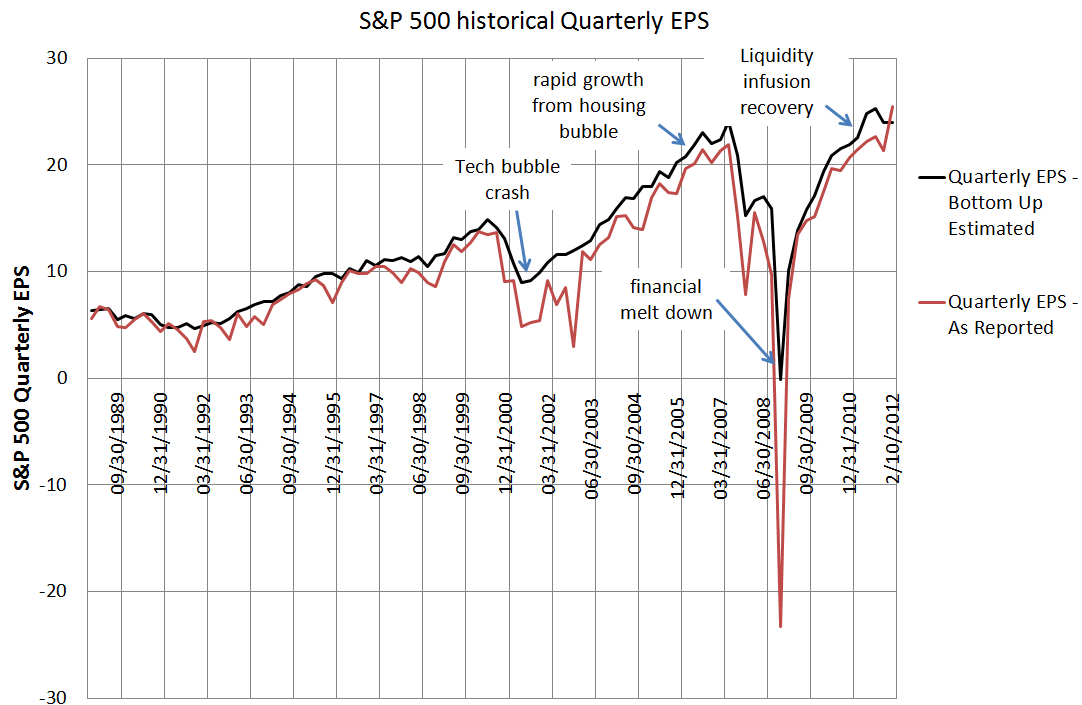
Starting with historical data on SP500 quarterly EPS,
The As Reported earnings are incomes from continuing operations, also known GAAP (Generally Accepted Accounting Principles). The Bottom up estimated earnings are Capital IQ consensus estimate for specific issue, building from the bottom up to the index level estimate. All data here and thereafter are all from S&P web site http://www.standardandpoors.com/indices/market-attributes/en/us.
We can see from the above figure that after 2008 financial crisis, the fundamentals keep improving and EPS stably grows. The other takeaways from the above figure are the post 2000 Tech bubble crash, rapid growth to the 2007 peak, and the current liquidity-infused recovery.
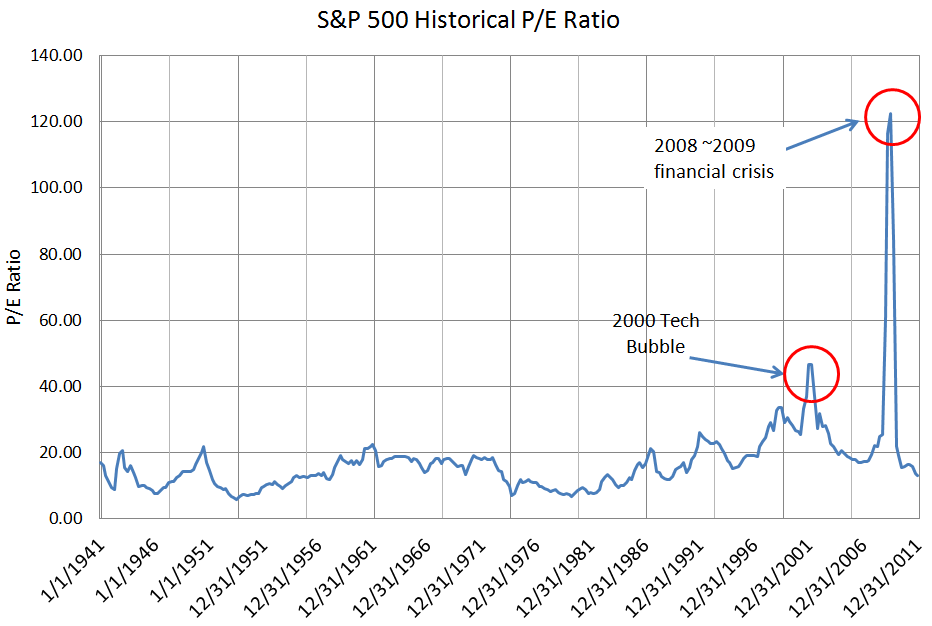
Next, the historical P/E ratios,
There is no theoretically ideal P/E ratio for S&P 500. During 1941-2011, the P/E ratio was mostly between 10 and 20, except for some brief periods. Jeremy Siegel in Stocks for the Long Run, (2002 edition) had argued that with the favorable developments like the lower capital gains tax rates and transaction costs, P/E ratio in “low twenties” is sustainable, although higher than the historic average. He has suggested that the average P/E ratio of about 15 (or earnings yield of about 6.6%) arises due to the long term returns for stocks of about 6.8%.
The simple average PE ratio from 1941 to 12/31/2011 is 16.90. If we take out two groups of big outliers, one from 2000 Tech bubble (the height of the Tech bubble P/E had risen to 32. The collapse in earnings caused P/E to rise to 46.50 in 2001) and the other one from 2008 ~2009 financial crisis (same thing, the height of the housing bubble P/E had risen to 25, and the crash in earnings caused P/E to rise to historically high to 122.41 in 2009), then we will have the average P/E ratio is ~15, which is the same as Siegel’s suggestion of “theoretical” P/E ratio.
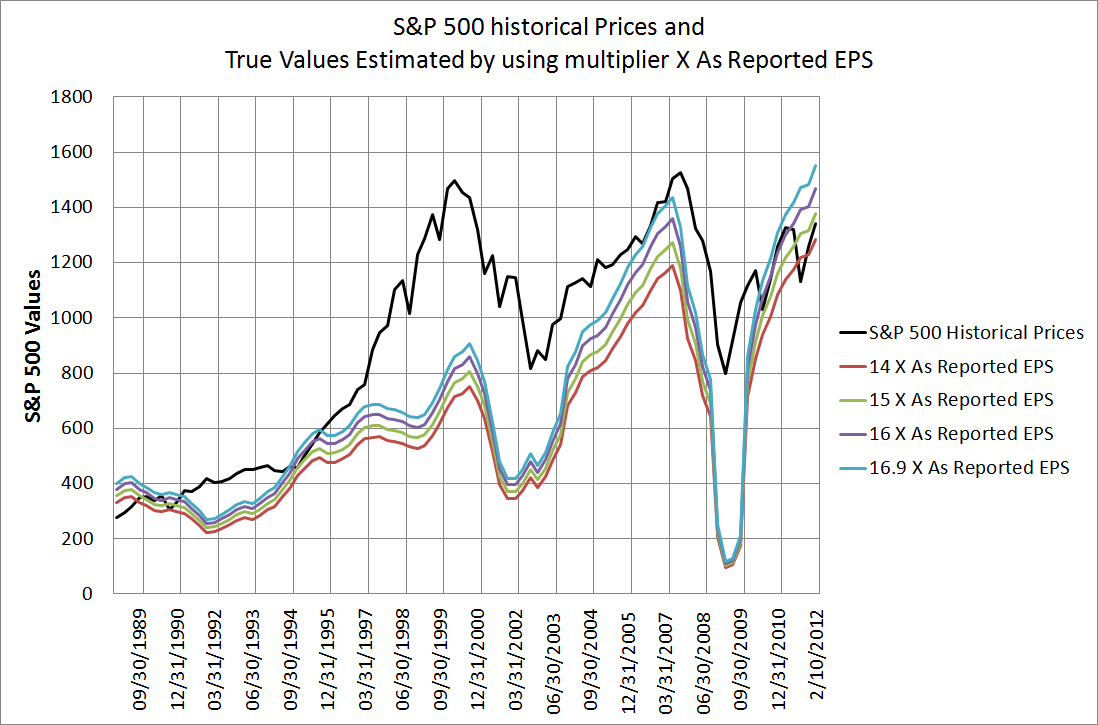
Finally, the historical S&P 500 prices and the estimated intrinsic values,
By using different P/E ratios (14 ~16.9) to multiply the trailing 12-month earnings, we can obtain the above figure. You can see from the above figure that, even though the earnings were not skyrocket in year 1999 ~ 2000, due to the bubble effects, the price of Sp500 shot up significantly high. Of course, it then miserably ended up with a hard landing in 2001. Similar scenario happened in 2008 ~2009.
Post 2009 crisis, sustained growth in EPS tended to propel prices gradually higher and higher. Yesterday’s SP500 price was 1351.77. Given different PE multipliers, we have the estimated SP500 intrinsic values to be,
- 14 X As Reported EPS: 1284.64
- 15 X As Reported EPS: 1376.40
- 16 X As Reported EPS: 1468.16
- 16.9 X As Reported EPS: 1550.74
So in conclusion, nowadays SP500 price is quite close to the “Intrinsic Value” according to the historical average of PE ratio.
My corresponding investment Strategies:
I am getting ready to sell index funds in my 401k plans (once SP500 price becomes 1376.40) since there is not much Margin of Safety left. After the sale, I am going to wait for SP500 to have a significant downside (at least 5%) deviation from intrinsic value, then start to buy in again (first large index fund, then small index fund when downside is at least 10%). The downside risks that I am looking at are possibly (1) episode of euro crisis; (2) Iran war; (3) US debt crisis; (4) something unknown.


14 Responses to Is the current market over-valued? – Part I: answers from P/E ratio