Amid the current tumultuous stock market, have you ever wondered what this market real worth? In other words, is it under-valued so that you can think about buying “risky” equities or is it over-valued so that you need to sidestep?
To put this in perspective, let us firstly conduct some simple fundamental analyses of market “intrinsic” value.
Let us start with relative valuation – P/E ratio …
The P/E ratio (price-to-earnings ratio) of a stock is a usual and simple measure of the price paid for a stock relative to the annual net income or profit earned by the company per share. The most common means to calculate PE is called “Trailing P/E” or “P/E ttm”, i.e. earnings per share for the most recent 12 month period, divided by the number of shares issued.
To calculate the P/E ratio of a market index like S&P 500, the proper method is to compute a weighted average (stock weight based on relative capitalization) since S&P
500 is a capitalization-weighted index. In this case, each company stock’s market cap is summed to give the total value in terms of market capitalization, and each company’s net earnings per share is added together to give the total value in terms of market earnings for the index.
Now we are going to compare our current P/E to the historic P/E in order to gauge whether market is cheap or expensive.
-
historic Price-to-Earnings (P/E) ratio
Cited from Wikipedia http://en.wikipedia.org/wiki/P/E_ratio#cite_note-8, we recognize that during 1920-1990, the P/E ratio was typically from10 to 20, except for some brief periods. Jeremy Siegel has suggested that the average P/E ratio of about 15 (or earnings yield of about 6.6%) arises due to the long term returns for stocks of about 6.8%.
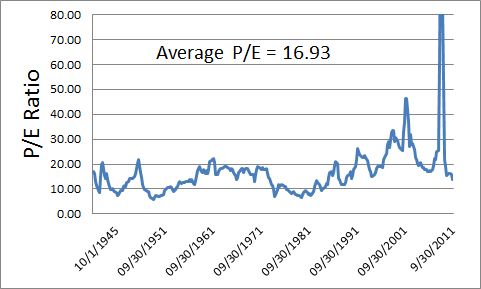
According to S&P 500 historical reported P/E Ratio (http://www.standardandpoors.com/indices/sp-500/en/us/?indexId=spusa-500-usduf–p-us-l–), the historic P/E ratio is shown as Figure 1 as follow. The average P/E ratio from year 1941 to 2011 is 16.93, which is quite close to the estimation from Jeremy Siegel.
Please note that the earnings in P/E above are estimated from top-down method. In this case, S&P Economics Department estimates incorporates models (economic, financial, policy) not down to the issue level.
Figure 1. S&P 500 P/E Ratio from 1941 to 09/2011 (earnings estimation using top down method)
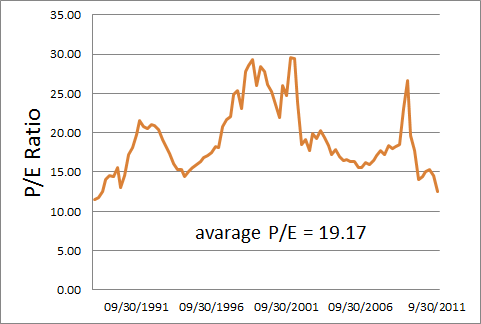
By using bottom up estimation for earnings (in this case Capital IQ consensus estimate for specific issue, building from the bottom up to the index level estimate), the historic P/E ratio is plotted as Figure 2. The mean value of P/E from 1988 to today is 19.17.
Figure 2. S&P 500 P/E Ratio from 1988 to 09/2011 (earnings estimation using bottome up method)
In sum, the mean value of historic P/E ratio is around 15 to 19.
- Current Price-to-Earnings (P/E) ratio and what does it tells us
The price of S&P500 at 09/30/2011 was $1131.42, therefore,
- earning per share (ests from bottom up) was $94.66, P/E was 11.95
- reported earning per share (ests from top down) was $87.03, P/E was 13.00
The price of S&P500 at 11/23/2011 was $1161.79, given the estimated earnings at 12/31/2011,
- earning per share (ests from bottom up) was $97.48,P/E was 11.92
- reported earning per share (ests from top down) was $89.36. P/E was 13.00
Evidently, even though given the conservative average P/E ratio at 15, the current P/E ratio is 13% to 20% below the historical average. Therefore, current market is well under-valued.


One Response to Is the current stock market cheap? Part I – What does P/E ratio tell us?