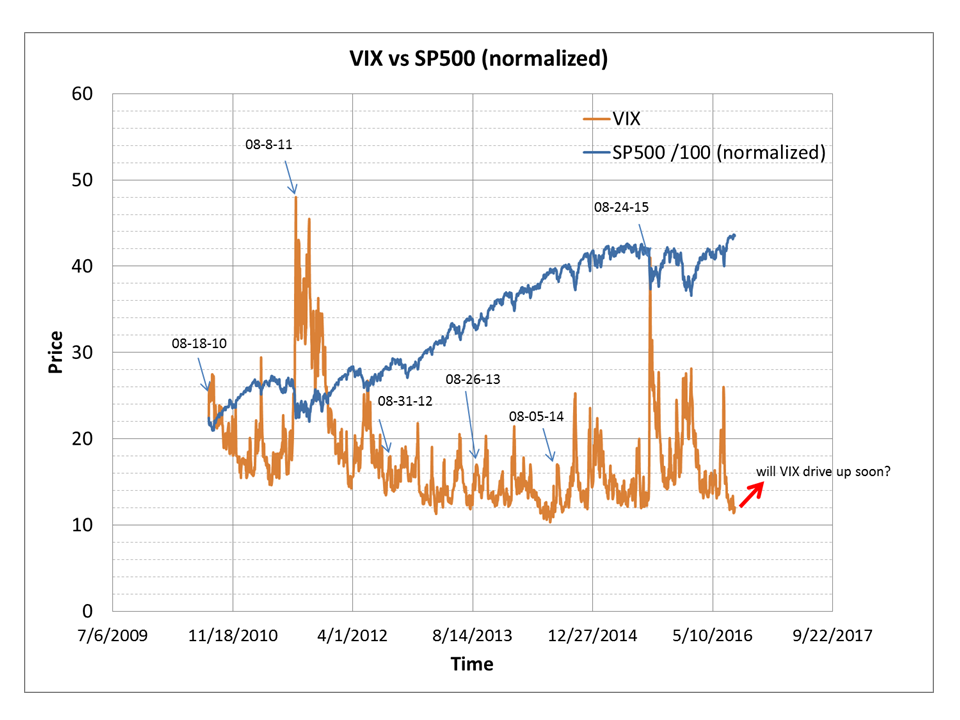
Be on alert for a pop on VIX
see Fatpitch’s alert (link)- very important On Alert For A Pop in VIX
My actions – 1) ready to buy call options of VIX; 2) ready to sell some positions
Aug 11’s VIX is 11.68, today (Sept 09)’s VIX is 17.50, the change is +49.8%.
- If I bought VIX option Feb-2017 strike $12, at Aug-11-2016 it is $7.6, then at Sep-09, it changes to $8.27, increase by 8.82%
- If I bought VIX option Sep-28-2016 strike $12, at Aug-11-2016 it is $2.00, then at Sep-09, it changes to $4.10, increase by 105%
correction: SP500 normalized should be SP500/50, not SP500/100. Be aware!
That is not to say that the SPX will necessarily rise. A low Vix can correspond with a short term top in SPX, too. But the relationship is too inconsistent to be a useful bearish predictor on its own. Note in the charts below that Vix can stay persistently very low while SPX continues to rise. A pop higher in Vix is inevitable, but timing that pop can be problematic. Vix was persistently very low for half a year at the end of 2006 and into 2007, for example.


The low Vix now corresponds with an unusually tight trading range in SPX. The 20-day Bollinger Bands on SPX have not been this tight since September 2014. In the next month, SPX dropped about 8%. Similar cases have also preceded large drops in SPX greater than 5% (red arrows). But, again, the relationship is inconsistent: tight Bollinger Bands have also resolved with minor drops in SPX (under 2%) and preceded a significant move higher over the following months (green arrows).

So its interesting that in each of the past 7 years, Vix has popped higher in August at some point (lower panel). That pop typically wakes the equity market up and leads SPX lower (top panel). Note in the chart below, however, that Vix popped higher in 2012 without any noteworthy adverse reaction from SPX until mid-September.


