Study of RUT (Russell 2000) and IWM
Catalyst
- economy continue to reopen, benefits most to small businesses
- stock rotation from big high tech (too high price of stock) to small businesses
- higher interest rate makes banks lending to small business easier
risk
- inflation – Higher prices for materials and rising borrowing costs make it more difficult for small businesses to operate. It is harder for the smaller entities than their larger peers to push higher operating costs onto the consumer.
***************************************************************
- 12/05/2024 – For Small-Cap Stocks, Look Past the ‘Trump Trade’ – WSJ Tariff and rate-cut expectations have boosted shares of smaller companies, but investors should focus on long-term appeal – it seems like IWM still has a lot of room to grow and outperform. The S&P 600 now trades at 18 times the earnings generated over the past 12 months, compared with 28 times for the S&P 500, according to FactSet. It is also a boon for the fund-management industry, because this is one of the few corners of the market in which actively managed funds can still claim to do better than index trackers and charge fatter fees. Between 25% and 40% of small-cap indexes are made up of unprofitable companies, and it has usually been a good strategy to avoid them. Indeed, stock pickers have been able to generate excess returns simply by being benchmarked to the popular Russell 2000 index while aping the S&P 600, which screens stocks for profitability, liquidity and investability.
Small-capitalization stocks are having their moment in the sun as part of the “Trump trade.” Whether they end up having staying power might have little to do with tariffs.
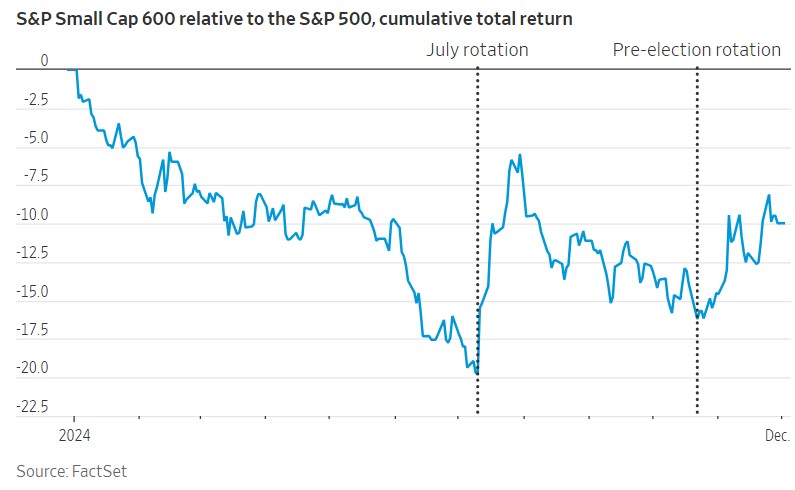
Since the Nov. 5 election, the S&P SmallCap 600 Index is up nearly 8%, compared with a roughly 5% gain for the S&P 500. Top risers include regional bank Dime and car-rental company Hertz, which have market values below $2 billion.

Back in July, Trump’s improving chances for victory, as well as disappointing earnings by some technology companies, had already pushed money into small-cap funds. Yet for 2024 as a whole, the S&P 600 still lags behind its blue-chip counterpart by more than 10 percentage points. Since the end of 2019, the shortfall is almost 40 percentage points.
Catalysts for a more lasting shift are accumulating. The Republican Party’s sweep appears to herald lower taxes, lighter financial regulations and higher tariffs, which Wall Street believes will benefit domestically oriented businesses more than multinationals.
The S&P 500’s gains also have been so top-heavy that its largest 10 companies now make up the biggest part of the index ever.
Small-caps should be more than a short-term trade, though.
the compelling reason to buy these stocks is that, since 2015, small-caps have been cheaper than blue-chips. The S&P 600 now trades at 18 times the earnings generated over the past 12 months, compared with 28 times for the S&P 500, according to FactSet.

According to monthly data by Furey Research Partners going back to 1968, which includes only profitable companies, a valuation gap as large as the one at the end of November has historically led small-caps to outperform over the following five years 96% of the time, and 51% of the time by more than 10 percentage points. This is what happened after the Nifty Fifty era of the 1970s, when blue-chips were massively overvalued, and the dot-com bubble of the late 1990s and early 2000s.
When it comes to longer, 10-year stretches, smaller companies have been the place to be almost without regard to when investors bought them, French’s figures show. They have beaten out large-caps three-quarters of the time, even after stripping out the bottom 25% of largely uninvestable microcaps. It isn’t because they are riskier: Adjusted for volatility, the result is the same.

It is also a boon for the fund-management industry, because this is one of the few corners of the market in which actively managed funds can still claim to do better than index trackers and charge fatter fees. Between 25% and 40% of small-cap indexes are made up of unprofitable companies, and it has usually been a good strategy to avoid them. Indeed, stock pickers have been able to generate excess returns simply by being benchmarked to the popular Russell 2000 index while aping the S&P 600, which screens stocks for profitability, liquidity and investability.
On a rolling 10-year basis, the average annualized return for U.S. small-caps in the top 30% in terms of operating profitability has been 14% since 1963, compared with 12% for large-caps of similar profitability and 9% for small-caps ranking in the bottom 30% of profitability.
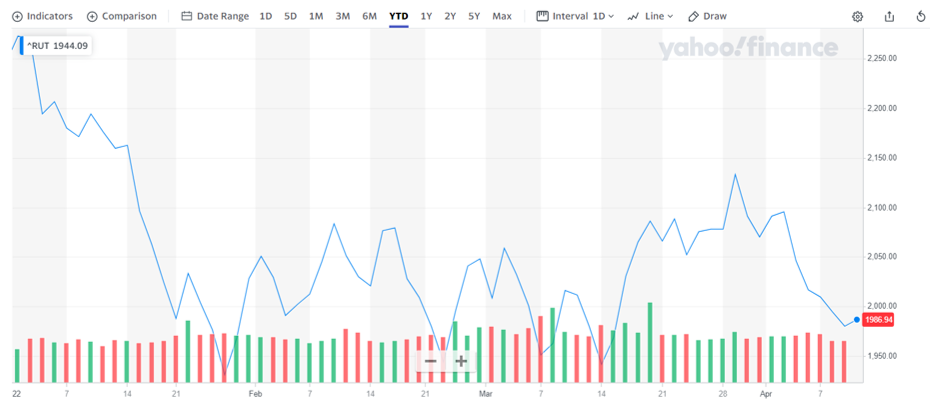
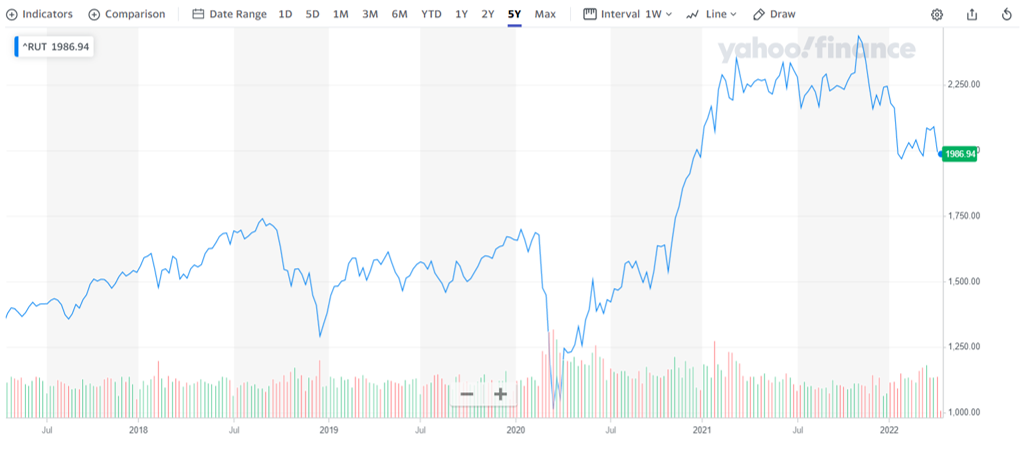
- 04/12/2022 – RUT history price, YTD down by -12.57% (from $2272.56 to $1986.94)


- 11/07/2021 – RUT is going to break out
This Group of Stocks Is About to Break Out
The past few weeks have been choppy for large-cap stocks. Investors have been set up for disappointment this earnings season, leading to short-term volatility.
The large-cap S&P 500 Index and the tech-heavy Nasdaq are up 6% and 10%, respectively, since late August. Still, it hasn’t been a smooth ride up… And investors are beginning to clue into what we have been saying: the slowing of earnings growth for the near future, fears over inflation, and concerns with Washington’s threatening deadlock.
While this doesn’t mean a crash is imminent, it does mean for the moment that large-cap names like Apple (AAPL) and Facebook (FB) may not be the best place to park your money.
Instead, another group of stocks has weathered this recent volatility even better than most: The Russell 2000 – the index of small and microcap names – is up 13% over the same period.
Part of the reason for this is that the Russell 2000 has been relatively stagnant since March, while the other indexes have continued to rally. The S&P 500 was up more than 15% from March through August. The Nasdaq was up more than 13% in the same period, while the Russell was flat.
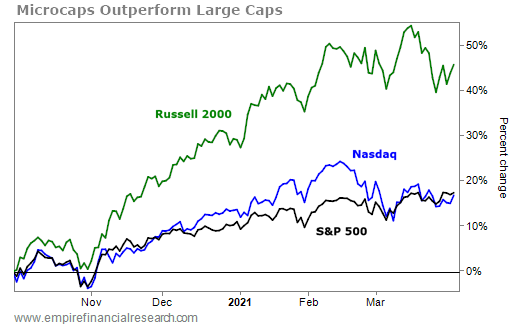
From October 2020 to March 2021, the S&P 500 and the Nasdaq were up less than 20% each. However, the Russell 2000 was up almost 50% during the same period…
As some technical analysts at Real Money and other outlets have highlighted, the Russell 2000 shows that the market is beginning to recognize the potential for another small-cap and microcap run. And it’s not based just on hype, but on fundamentals.

