
Study of XBI and LABU
Key Features of XBI
The SPDR® S&P® Biotech ETF seeks to provide investment results that, before fees and expenses, correspond generally to the total return performance of the S&P®
Biotechnology Select IndustryTM Index (the “Index”)
• Seeks to provide exposure to the Biotechnology segment of the S&P TMI, which comprises the following sub-industries: Biotechnology
• Seeks to track a modified equal weighted index which provides the potential for unconcentrated industry exposure across large, mid and small cap stocks
• Allows investors to take strategic or tactical positions at a more targeted level than traditional sector based investing
Valuation of XBI
Avg P/E Ratio 32.67, current P/E ratio 16.01
Avg Price/Book Ratio 7.53, current P/B ratio 3.61
Short Int = 57.58/76.25 = 75.51 (04/30/2024)
Official information of XBI
- XBI: SPDR® S&P® Biotech ETF (ssga.com)
- Fact Sheet:SPDR® S&P® Biotech ETF, Mar2024 (ssga.com)
- XBI | SPDR S&P Biotech ETF Stock Price, Quotes and News – WSJ
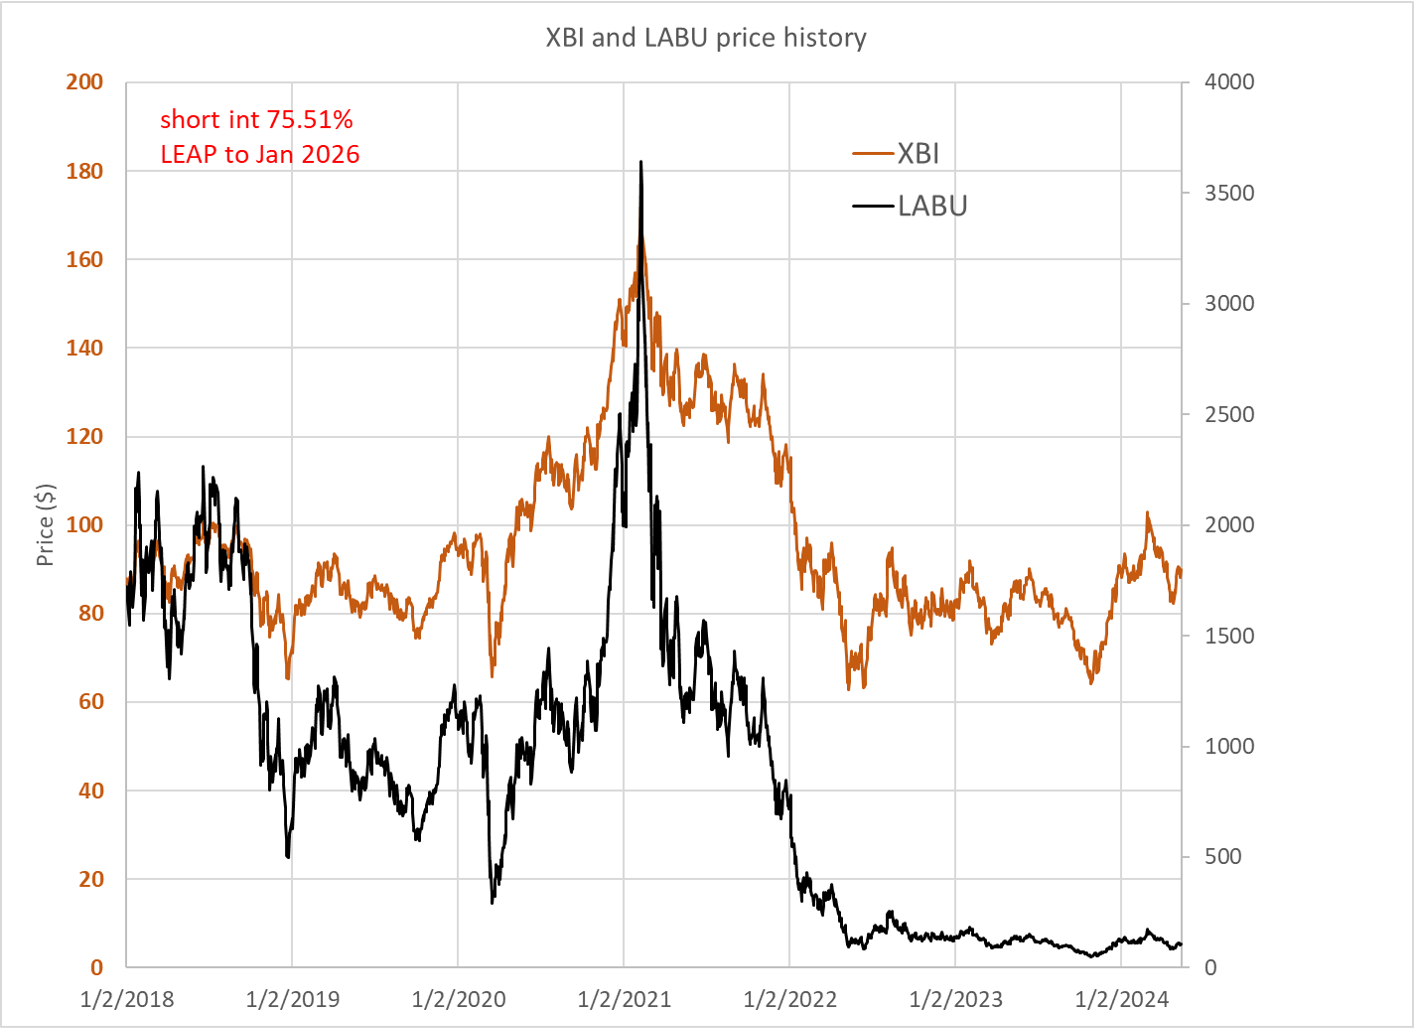
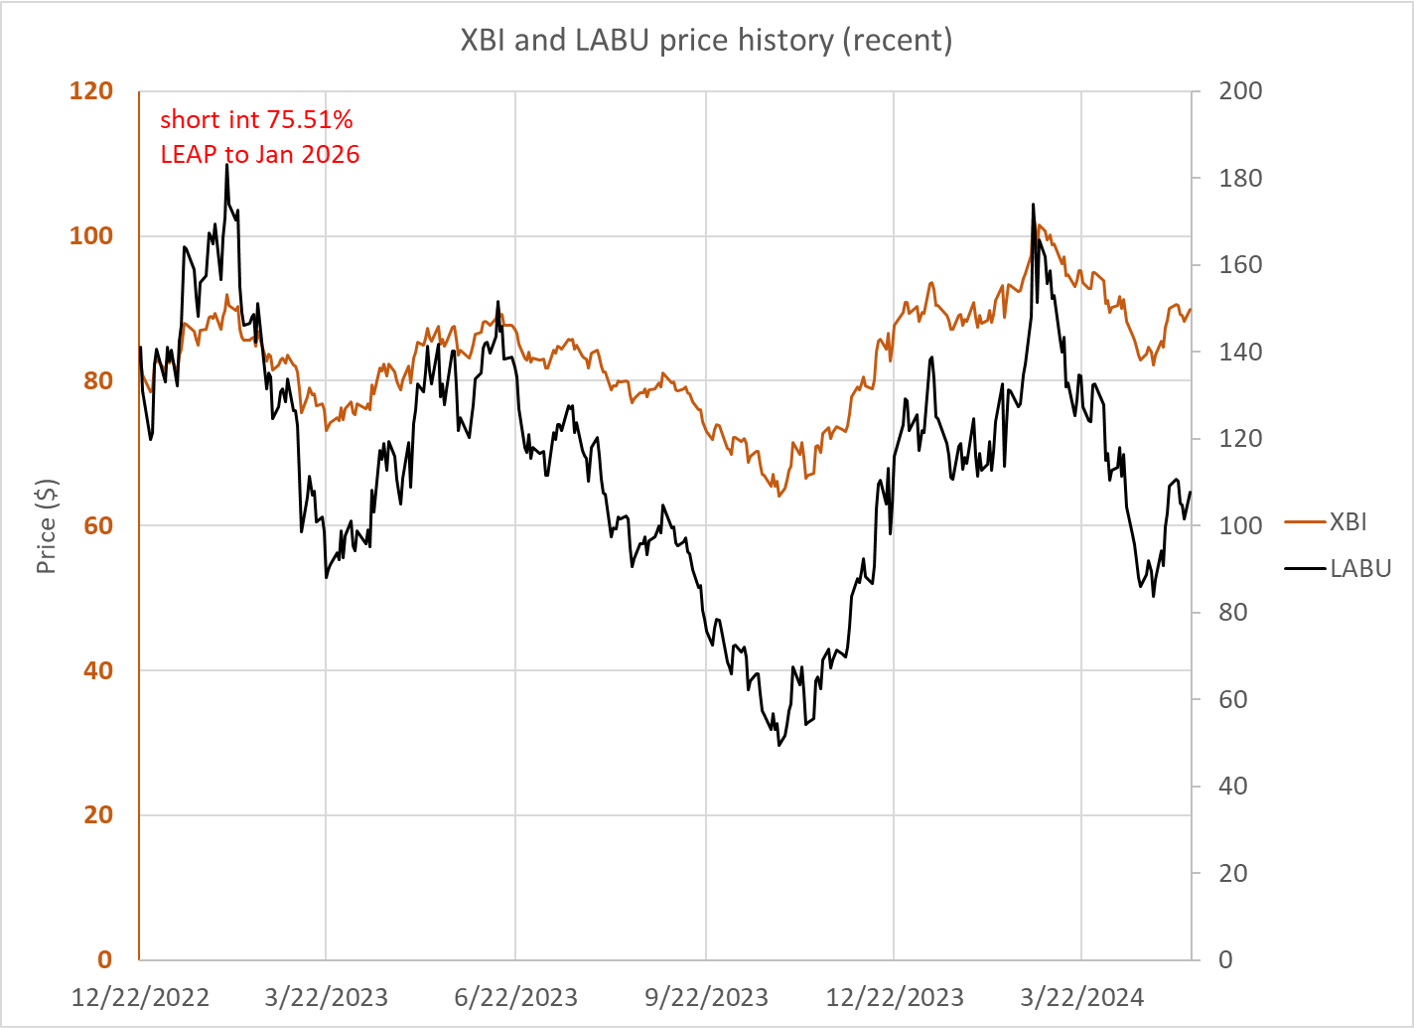
Price history of XBI and LABU
Investing strategy
LABU is a short and mid-term trading instrument for seasoned traders who execute a strategy with planned entry and exit signals, and who understand the fund’s behavior behind the leverage factor. For a very large majority of investors, the best strategy with LABU is described in two words: stay away.
Levered ETFs Only Designed To Work On Short Time Horizons – It is important to remember levered ETFs have ‘positive convexity’ in the direction of its bet (i.e. the exposure grows as the bet is winning), and it loses value from ‘volatility decay’.
Toma Hentea 16 Dec. 2023, 5:24 PM Investing Group LeaderPremium Comments (729) @TaiPan LABU should be sold as soon as the uptrend of the biotech index or its proxy, XBI, stalls. When XBI trades in a range without a clear uptrend, LABU starts having substantial losses over time, even if XBI is making small gains. The signals which can be used are a combination of trend indicators (moving averages, RSI, etc.)
From the chart it is also evident that both the index and the leveraged fund display long periods of directional trends. The chart may be broken down into 9 periods, as shown in the table below. For each period, we show the returns of the index SPSIBI and those of the leveraged fund, LABU.
| Period | INDEX | LABU |
| 5/28/15 – 7/17/15 | 15.06% | 48.37% |
| 7/17/15 – 2/11/16 | -49.49% | -91.05% |
| 2/11/16 – 6/20/18 | 122.01% | 453.11% |
| 6/20/18 – 12/24/18 | -35.29% | -78.02% |
| 12/24/18 – 3/20/20 | 5.64% | -33.83% |
| 3/20/20 – 2/8/21 | 151.40% | 1005.01% |
| 2/8/21 – 5/11/22 | -63.87% | -97.49% |
| 5/1122 – 10/27/23 | 2.23% | -45.99% |
| 10/27/23 – 12/15/23 | 33.82% | 123.25% |
Observations
- 4 periods when the index made big gains; over those periods, LABU returned more than three times. Extreme example: 3/20/20 – 2/8/21 the ratio was 6.63.
- 3 periods when the index suffered big losses; over those periods, LABU’s losses were harder to recover from. Extreme example: 2/8/21 – 5/11/22
- 2 periods when the index was range bound and made small gains; over those periods, LABU suffered significant losses.
The Biotechnology Index had long periods with extremely large returns. It also had similarly large declines. The leveraged fund amplified those moves. This shows the extreme risk of holding a leveraged fund in a bear market.
Loosening Financial Conditions A Tailwind For Biotech
Biotech companies are usually pre-revenue hyper-growth companies and are dependent on well-functioning capital markets and loose risk-appetites to finance their operations. When financial conditions tighten, equity financing becomes scarce and biotech stocks tend suffer. We can see this relationship graphically by overlaying the SPDR S&P Biotech ETF (XBI) against the Chicago Fed’s National Financial Conditions Index. When financial conditions tightened like they did in 2008-9, 2011, 2015-2016, 2020, and more recently, biotech stocks usually struggle (Figure 6).
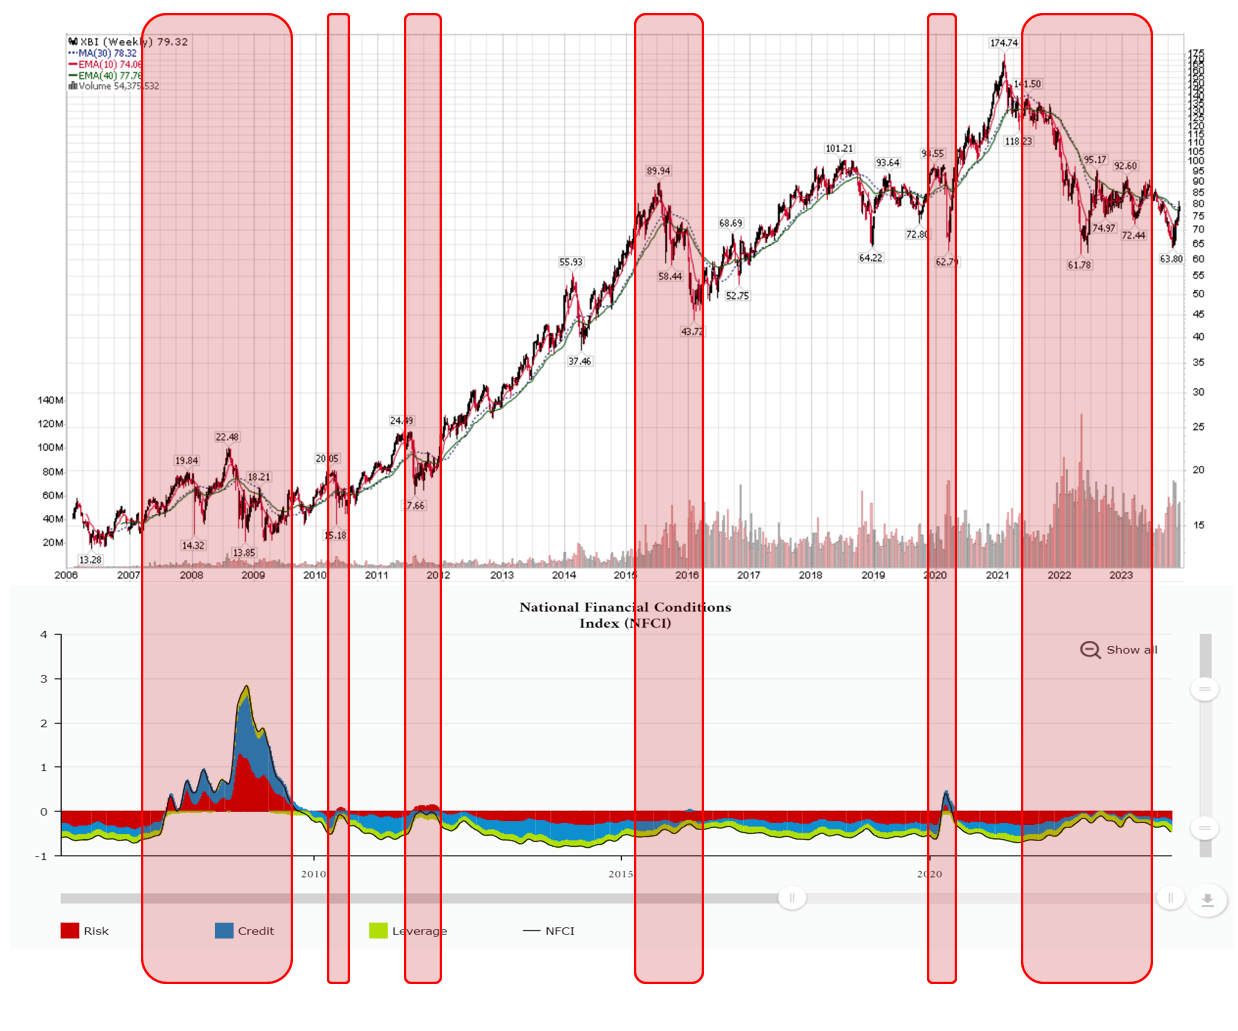
Figure 6 – Biotech stocks suffer when financial conditions tighten (Author created with price chart from stockcharts.com and data from Chicago Fed)
More recently, despite the Fed claiming to tighten monetary policies to combat inflation, financial conditions have actually been gradually loosening, with November 2023 readings back to early 2022 levels.
Loosening financial conditions is reigniting animal spirits, as seen from the recent rally of cryptocurrencies to speculative stocks like biotech. As long as financial conditions remain loose, biotech stocks should have a tailwind.
National Financial Conditions Index: Current Data – Federal Reserve Bank of Chicago (chicagofed.org)
The Chicago Fed’s National Financial Conditions Index (NFCI) provides a comprehensive weekly update on U.S. financial conditions in money markets, debt and equity markets, and the traditional and “shadow” banking systems. Because U.S. economic and financial conditions tend to be highly correlated, we also present an alternative index, the adjusted NFCI (ANFCI). This index isolates a component of financial conditions uncorrelated with economic conditions to provide an update on financial conditions relative to current economic conditions.
- 06/06/2024 – AI-discovered drugs have an 80%–90% success rate: study (msn.com)
- 06/06/2024 – AI plus gene editing promises to shift biotech into high gear (msn.com) Although the CRISPR-AI combination is still in its infancy, once it matures it is likely to be highly beneficial and could even help the world tackle climate change.
During her chemistry Nobel Prize lecture in 2018, Frances Arnold said, “Today we can for all practical purposes read, write and edit any sequence of DNA, but we cannot compose it.” That isn’t true anymore.
Since then, science and technology have progressed so much that artificial intelligence has learned to compose DNA, and with genetically modified bacteria, scientists are on their way to designing and making bespoke proteins.
- 06/01/2024 – Brainstorm Health 2024: What’s Next in Generative AI’s Revolution in Medicine | Watch (msn.com)
Dr. Isaac Kohane, Professor and Chair, Department of Biomedical Informatics, Harvard Medical School; Editor-in-Chief, NEJM AI Dr. Peter Lee, President, Microsoft Research, Microsoft Julie Yoo, General Partner, Andreessen Horowitz Moderator: Chrissy Farr, Owner and Editorial Lead, Second Opinion Media; Co-chair, Fortune Brainstorm Health
Evercore ISI launched its coverage with a bullish view on a number of biotech stocks on Tuesday, citing a more constructive view on the sector, which is seeing signs of recovery after years of underperformance.
Their views follow a recent upsurge in biotech stocks. Industry benchmark SPDR S&P Biotech ETF (XBI) has added ~39% since reaching a recent slump in Q4 2023, well ahead of the ~24% gain in the S&P 500 (SP500), the analysts led by Cory Kasimov point out.
However, XBI has lost ~48% while the S&P 500 added 32% since early 2021, when the sector peaked as interest rates bottomed out.
“After 3 years of painful underperformance, winter is finally thawing and spring just might be in the air,” Kasimov and the team wrote, adding they initiated coverage on the sector with “an increasingly constructive view that is more likely than not to improve over time.”
Evercore prefers companies with “clear clinical narratives and/or commercial upside,” and its biotech coverage extends from oncology and neuroscience to even stocks with activist involvement.
reader’s comment: Interest rates and AI will both help, IMO.
I’ve rotated to overweight in that sector.
The 10-year Yield
The key factor affecting biotech valuations remains the 10-year note yield, with a strong correlation between its movement and biotech performance. In November 2023, our report “Biotech Stocks Ready to Roar” highlighted the potential for a decline in the 10-year yield to support biotech valuations, which proved accurate as the S&P Biotechnology Index surged over 50% by the end of February.
However, since March, IBB and XBI have declined due to a sharper rise in yield, which has increased from 4.20% at the beginning of March to 4.70% at the start of May.
The robust negative correlation between the yield curve’s trajectory and the biotech industry’s fortunes is presented below. The highlighted section showed a yield decline in November last year, with no corresponding gains for the biotech index at that time, which increased the confidence that higher valuations were ahead.
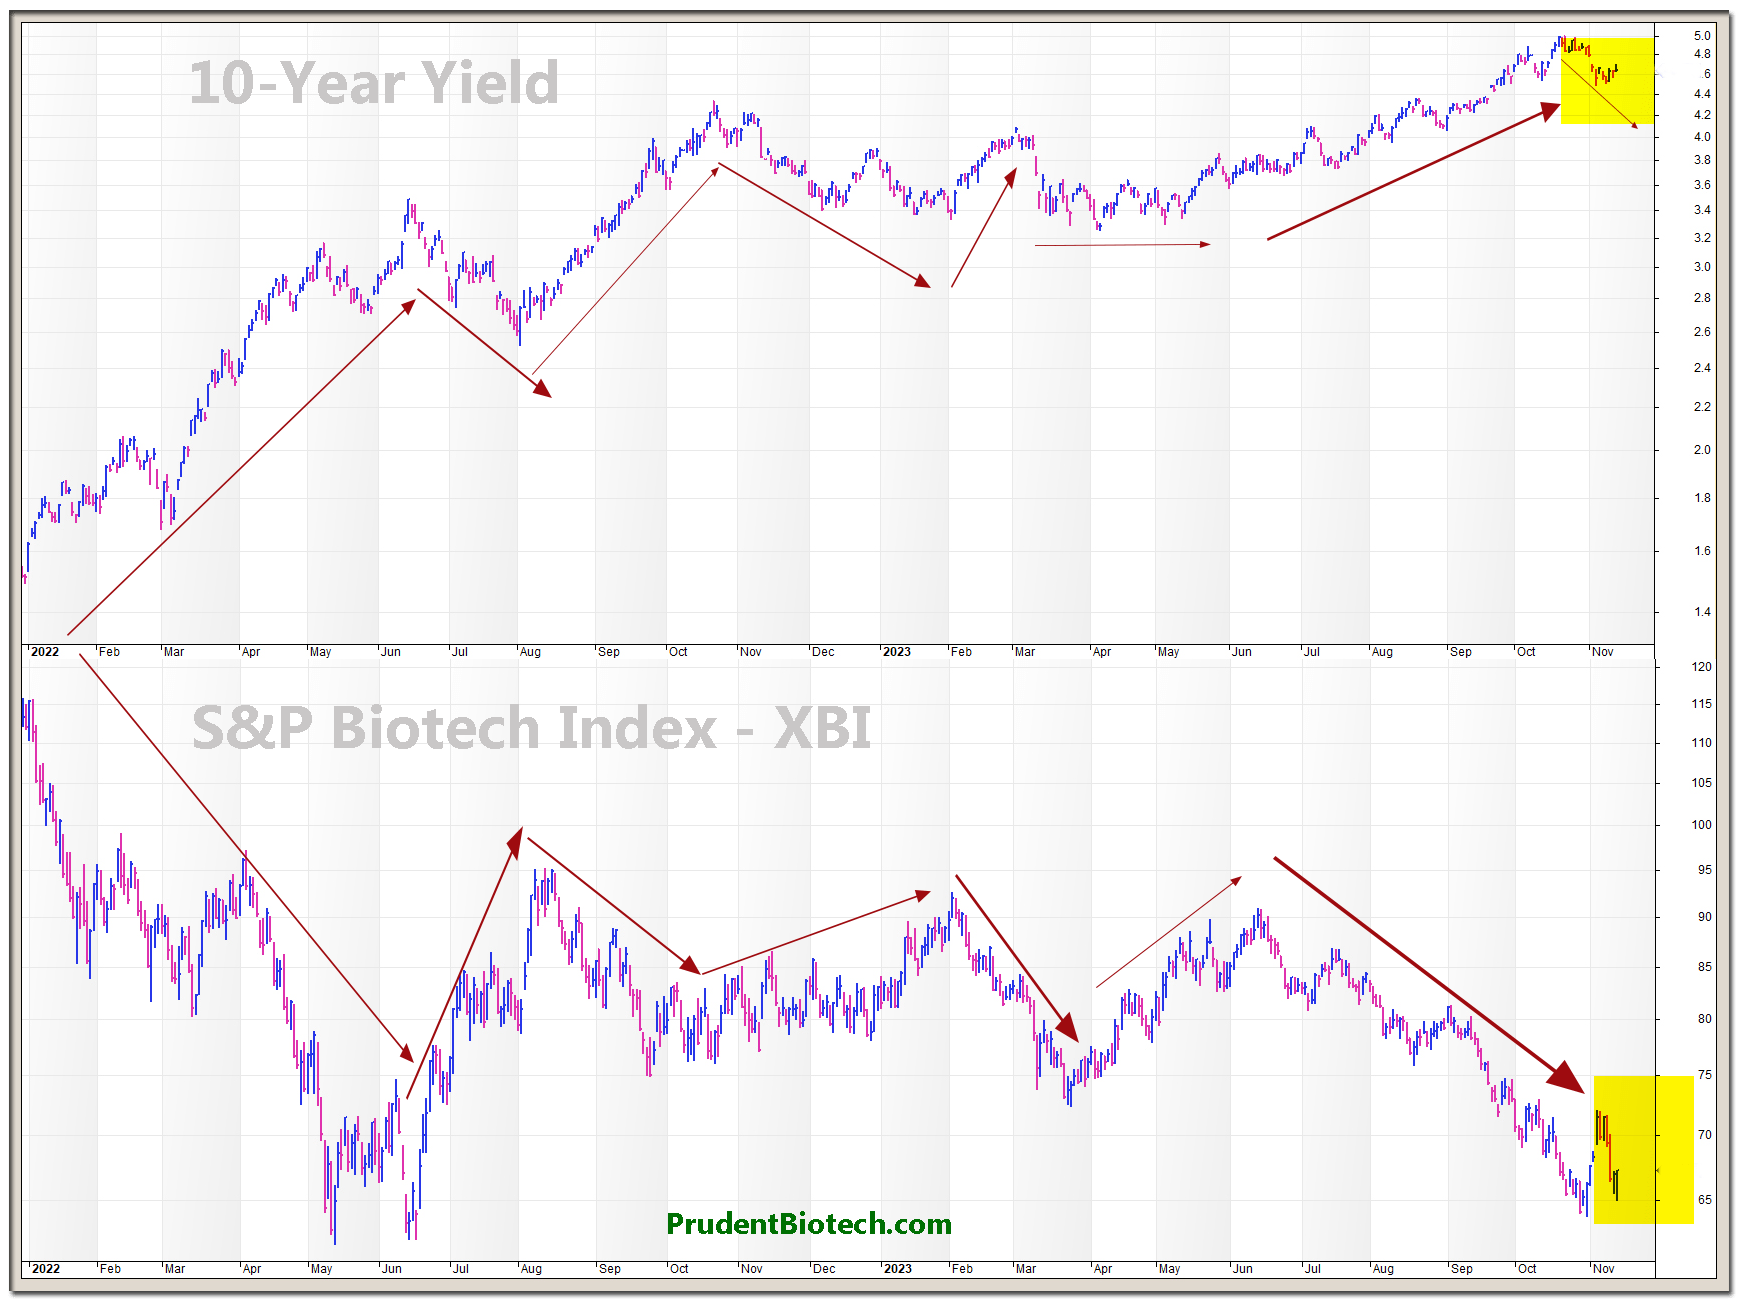
Correlation between the 10-Year Bond Yield and the S&P Biotechnology Index (PrudentBiotech.com)
The 10-year yield is the preferred proxy for a risk-free discount rate for the long term. A rising yield raises the discount rate at which future corporate earnings are discounted. The rising yield poses challenges for biotech companies, as it increases the discount rate for future corporate earnings and diminishes the risk appetite for speculative stocks. The challenge is quite pronounced as emerging biotechs have neither revenues nor earnings to mitigate the impact of rising yields, but trade solely on the promise of their drug pipelines.
3 Key Points And Reasons To Buy This ETF And Hold It
1) There is an obvious correlation (inverse) between interest rates and growth stocks, including the biotech sector. You can see this ETF was performing very well when rates were lower. It performed poorly during the rate hiking cycle, and then late in 2023, and right around the time that Jerome Powell made comments suggesting that rate hikes were likely no longer in the cards, this ETF started to rally again. It is possible that the Federal Reserve will delay rate cuts, but I think it is just a matter of time before rate cuts happen.
On March 20, 2024, the Federal Reserve released projections which imply a 2.25 point drop in the Fed Funds rate by the end of 2026. This would reduce the Fed funds target rate from the current range of 5.25% to 5.5%, to somewhere between 3% to 3.25%, by the end of 2026. This would represent a roughly 40% drop in rates over the next couple of years. I think it is clear that this ETF will turn in a strong performance as soon as rates are cut and that outperformance could continue into 2026, as rates potentially hit the lows of this easing cycle sometime that year.
Analysts at Morgan Stanley (MS) have studied the correlation and historical patterns between the biotech sector and interest rates. An article from SA News points out that the biotech sector consistently outperforms the market leading up to an initial rate cut, and that the biotech sector tends to appreciate 20% to 30% within 6 to 12 months.
2) The biotech sector is seeing increased levels of merger and acquisition deals recently. This shows valuations are attractive to other companies, in particular to big pharmaceutical companies who need to make acquisitions in order to counteract the patent expirations that they face. We are just barely into the second quarter of 2024, and already more than a dozen major buyout deals have been announced. Many of these deals have come with a huge premium over what the shares were trading for prior to the deal announcement. This is another sign that many biotech stocks are potentially significantly undervalued.
Here are a few examples of some of the big M&A deals of 2024:
Gilead (GILD) agreed to acquire CymaBay on 2/12/24 for a 27% premium. Johnson & Johnson (JNJ) agreed to acquire Ambrx Biopharma in January 2024, for a 105% premium. Also in January, Merck & Co. (MRK) agreed to acquire Harpoon Therapeutics for a 118% premium. In March 2024, AbbVie (ABBV) agreed to acquire Landos Biopharma for a 155% premium. These are just a few of the deals, but it shows that premiums are very elevated, and that could mean there is significant undervaluation in many biotech stocks. This pace of deals also shows that many more deals could potentially be announced during 2024 and beyond. I think smart pharma companies are realizing that biotech valuations are likely to get more expensive when rates decline, and that is driving these companies to pick up the pace of acquisitions.
3) AI could significantly speed up development of earlier stage treatments, and also help develop new cures. Faster and less expensive drug discovery could accelerate gains for investors. A study by McKinsey & Company details these likely benefits of AI for the biotech industry and states:
“Many diseases today don’t have a cure. One reason is that drug discovery is difficult: finding and developing an effective medicine is a yearslong and very expensive process. But maybe it doesn’t have to be. Experts say AI—if properly integrated into scientists’ research—could revolutionize drug discovery, making it possible for more patients to get the treatments they need.”
Potential Downside Risks
Higher for longer interest rates are clearly a potential downside risk. As investors know, the risk of clinical trial failures is high, particularly when investing in single stocks. That is one reason why I prefer the diversification that a biotech ETF like XBI offers. Biotech stocks can be very volatile and this can be a potential downside risk, since some investors could be inclined to sell in a moment of weakness, which is a common occurrence for stocks in this sector.
Morgan Stanley sees biotech stocks poised to rally, with outperformance fueled by an expected Fed rate cut and uptick in M&A activity.
In a recent note, Morgan Stanley said a review of historical data shows the biotech sector has consistently appeared to outperform the market in the months leading up to an initial cut, followed by roughly a month of underperformance. Stock prices begin to climb again shortly thereafter, with the sector generally seeing appreciation of around 20% to 30% six to 12 months out.
The bank said that it expects to see the first rate cut in June, with four 25bp cuts in total for 2024.
Lower rates have also historically coincided with increased M&A, which has already seen significant action in recent months as major drugmakers move to replenish product portfolios.
“Outside of the interest rate outlook, we believe that there remains a fundamental need for SMID biotech M&A, which is driven by the patent expirations that the large cap biopharma companies are expected to face in the end of this decade and the highly cash generative nature of their businesses,” the bank said.
Morgan Stanley estimates that $182B in 2024 revenue, or 41% of total 2024 revenue, is slated to lose patent protection by 2030. Amgen is facing the steepest percentage drop, with 68% of its 2024 revenue at stake, followed by Bristol Myers (BMY) with 64%, Merck (NYSE:MRK) with 56%, Johnson & Johnson’s pharma division with 51%, and Pfizer (PFE), ex-COVID, at 40%.
Meanwhile, the bank pegs the sector’s M&A capacity at $468B, which it calculates as 2.5x net debt/2024E EBITDA. Johnson & Johnson (JNJ) tops the bank’s potential M&A capacity list, with Novo Nordisk (NVO), Merck (MRK), Roche (OTCQX:RHHBY) and Novartis (NVS) rounding out the top five.
Morgan Stanley sees oncology and immunology assets continuing to generate the most interest among potential acquirers, with CNS/neuroscience also attracting attention in the wake of the Bristol Myers/Karuna and AbbVie/Cerevel deals. It also sees companies across the sector continuing to focus on bolt-on deals valued at under $5B.
- 03/30/2024 – XBI: Biotech Is A Strong Buy As M&A Activity Picks Up (Rating Upgrade) (NYSEARCA:XBI) | Seeking Alpha Price at publication
$93.5
- Shares of biotechnology companies have been lagging behind the S&P 500 Index.
- This underperformance of XBI relative to the S&P 500, however, has only made the opportunity even more attractive to us.
- Evidence of improving fundamentals and rising mergers and acquisitions (M&A) activity within the biotechnology space has been underappreciated by investors.
- Furthermore, valuations on XBI is compelling at just 14.3x forward P/E, versus 25x on the S&P 500 Index.
- We upgrade our rating for XBI from “Buy” to “Strong Buy”.
Biotech M&A Is Picking Up
We are already beginning to see more evidence of improving fundamentals and rising mergers and acquisitions (M&A) activity within the biotechnology space. And these improvements have yet to be fully appreciated by investors, in our view.
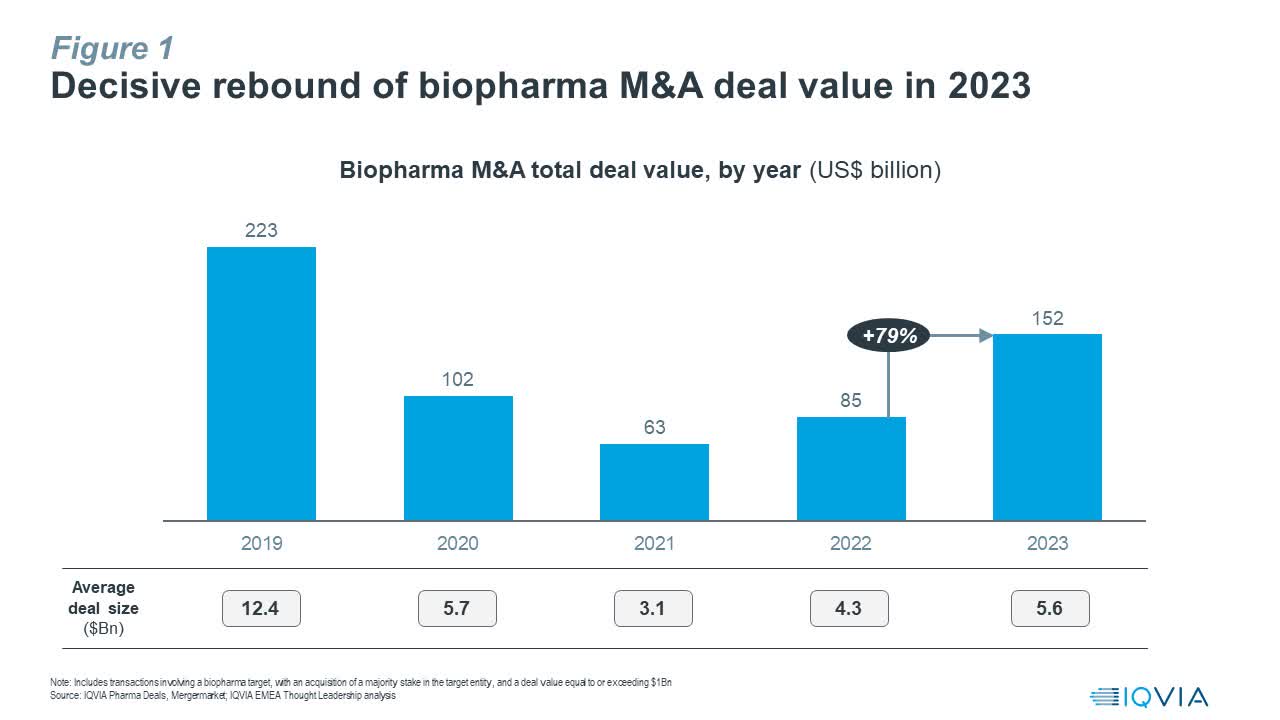
As the accompanying chart shows, the total value of biotechnology and pharmaceutical M&As has rebounded by 79% in 2023. At US$152 billion, the total value of M&A deals is still well below 2019 levels of US$223 billion, suggesting room for further upside in 2024.
IQVIA
Several factors are driving this recovery in M&A activity. Firstly, higher interest rates following a series of rate hikes by the Fed, economic uncertainties during and post-Covid19, and valuation mark-downs have all encouraged biotech investors to stay at the sidelines since 2020. Investment plans were temporarily shelved while hiring headcounts were frozen to preserve cash and assuage investors in this challenging business environment. Now that the prospect for rate cuts is clearer, and valuations for biotech have bottomed, investors are feeling more confident and willing to deploy their dry powder again.
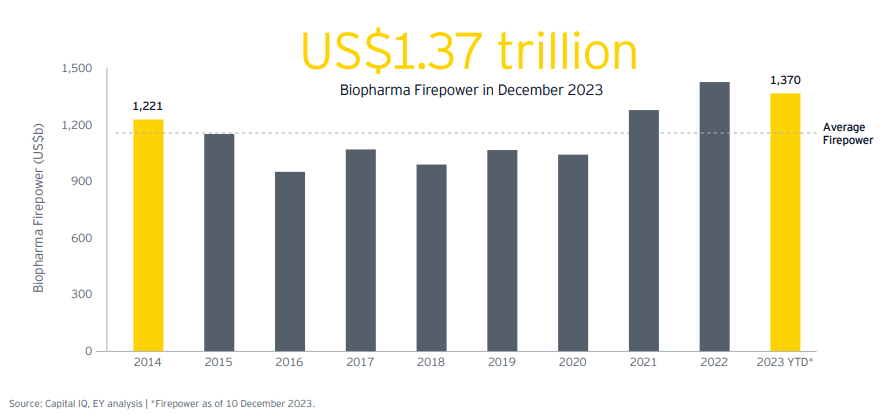
According to a recent report published by Ernst & Young, companies in the biotechnology and pharmaceutical sectors are estimated to have around US$1.37 trillion at their disposal for acquisitions, which is close to an all-time high. As these companies compete for deals, there has been an observed increase in aggressive acquisition offers with higher premiums.
2024 EY M&A Firepower report
Another factor driving this M&A recovery in biotech is the looming threat of a “patent cliff”, where large pharmaceutical companies including Bristol Myers Squibb (BMY), Merck (MRK), Pfizer (PFE), and Johnson & Johnson (JNJ) are expecting blockbuster drugs to lose their patent and exclusivity protections. This “patent cliff” not only represents a threat to revenues and market shares for these companies but also presents a potential growth gap of over US$120 billion by 2028.
Fed Rate Cut A Matter Of When Not If
Although the prospect of a delayed rate cut by the Fed has risen significantly in recent weeks, we still see rate cuts as a matter of when not if. We are increasingly concerned that delaying rate cuts will only increase the risk of a recession, which means that the Fed may have to cut rates even more aggressively later on. Nonetheless, so long we do not see a deep recession, we still think biotechnology stocks will outperform in the next couple of years.
We see the potential for XBI to catch up to the S&P 500 in performance while providing some margin of safety due to modest valuations on biotech. All these should translate into the potential for alpha.
SPDR S&P Biotech ETF (XBI)
Crucially, we reiterate our strategy to invest broadly across large, mid and small-cap biotech names. This is necessary to manage the high idiosyncratic risks associated with the performance of biotech companies. We believe that our more passive approach to investing broadly across the biotech space will allow us to capture gains from a general recovery of the biotech sector and M&A activity while avoiding unnecessary idiosyncratic risks.
The XBI is ideal for our purposes. According to fund information provided by the issuer State Street Global Advisors, XBI seeks to provide investment results that correspond generally to the total return performance of the S&P Biotechnology Select Industry Index. The index is a modified equal-weighted index which provides the potential for unconcentrated industry exposure across large, mid and small-cap biotech stocks.
As the accompanying table shows, XBI’s top ten holdings make up just under 11% of the fund’s portfolio. Furthermore, each of XBI’s top ten holdings makes up around just 1.03% to 1.15% of the portfolio individually.
In terms of valuation, the XBI is still trading at a compelling forward P/E multiple of 14.3x. This versus the increasingly expensive S&P 500 Index, which is trading at around 25x forward P/E, presents a compelling value opportunity to be bullish XBI in our view.
- 03/20/2024 – XBI: Biotech Is A Strong Buy As M&A Activity Picks Up (Rating Upgrade) (NYSEARCA:XBI) | Seeking Alpha XBI Price at publication
$93.5
- Shares of biotechnology companies have been lagging behind the S&P 500 Index.
- This underperformance of XBI relative to the S&P 500, however, has only made the opportunity even more attractive to us.
- Evidence of improving fundamentals and rising mergers and acquisitions (M&A) activity within the biotechnology space has been underappreciated by investors.
- Furthermore, valuations on XBI is compelling at just 14.3x forward P/E, versus 25x on the S&P 500 Index.
- We upgrade our rating for XBI from “Buy” to “Strong Buy”.
- 03/03/2024 – LABU: A Really Bad Drift | Seeking Alpha beware of the drift of LABU
- Leveraged ETFs have a non-linear, unpredictable behavior.
- Here is a drift dashboard with 22 leveraged ETFs. Direxion Daily S&P Biotech Bull 3X Shares ETF is the worst.
- LABU is an instrument for seasoned traders with planned entry and exit signals. Without a tested strategy and daily monitoring, it is an accident waiting to happen.
- I am Fred Piard, a quantitative analyst with a PhD in computer science. I run the investing group Quantitative Risk & Value where I share data driven portfolios and risk indicators.
Why do leveraged ETFs drift?
Leveraged ETFs often underperform their underlying index leveraged by the same factor. ETF decay may have four reasons: beta-slippage, roll yield, tracking errors, management costs. Beta-slippage is the main reason in equity leveraged ETFs. To understand it, imagine a very volatile asset that goes up 25% one day and down 20% the day after. A perfect 2x leveraged ETF goes up 50% the first day and down 40% the second day. On the close of the second day, the underlying asset is back to its initial price:
(1 + 0.25) x (1 – 0.2) = 1
In the same time, the perfect leveraged ETF has lost 10%:
(1 + 0.5) x (1 – 0.4) = 0.9
It is the normal effect of leveraging and rebalancing. In a trending market, beta-slippage can be positive. If the underlying index goes up 10% two days in a row, on the second day, it is up 21%:
(1 + 0.1) x (1 + 0.1) = 1.21
The perfect 2x leveraged ETFs is up 44%:
(1 + 0.2) x (1 + 0.2) = 1.44
Beta-slippage is path-dependent. If the underlying index gains 50% on day 1 and loses 33.33% on day 2, it is back to its initial value, like in the first example. However, the 2x ETF loses one third of its value, instead of 10% in the first case:
(1 + 1) x (1 – 0.6667) = 0.6667
Without a demonstration, it shows that the higher the volatility, the higher the decay.
LABU aims at a daily return of 3 times the daily performance of the underlying index of XBI. Since inception, LABU has lost 95.4% of its value while XBI has gained 25.5%. People who say that a leveraged ETF “will always recover one day” don’t understand slippage. In the case of LABU, I take little risk if I say it will never happen. As plotted on the next chart, LABU has lost 88% in 5 years and XBI gained about 9%. This chart shows how a leveraged ETF can spike in a strong rally (here in 2021), collapse in a correction, then slowly decay in a sideways market.
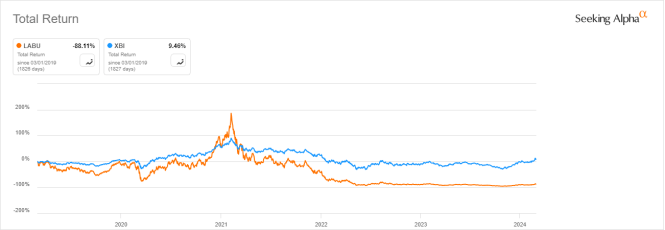
As a conclusion, LABU is a short-term trading instrument for seasoned traders who execute a strategy with planned entry and exit signals, and who understand the fund’s behavior behind the leverage factor. For a very large majority of investors, the best strategy with LABU is described in two words: stay away.
- 12/16/2023 – LABU – BUY As The Biotech Sector Starts A New Bull Market (Technical Analysis) | Seeking Alpha
Analysis of the leverage effect
Because LABU is a leveraged instrument, it is appropriate to analyze its performance relative to the stock index on which it is based. The next chart shows LABU’s (red) price evolution versus that of the Biotechnology Index $SPSIBI (blue).
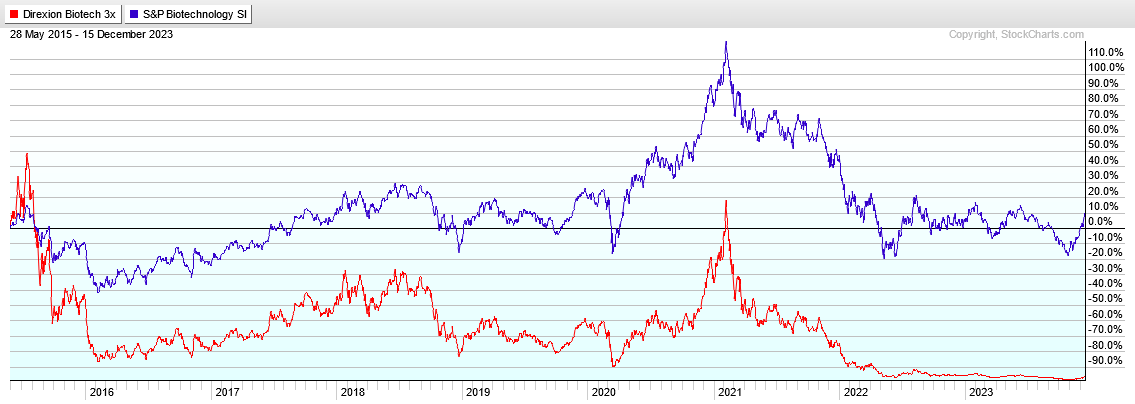
stockcharts.com
The chart clearly shows that LABU is not suitable for long term holding. While the index has returned about 10% since the fund’s inception, the leveraged fund lost about 97%.
From the chart it is also evident that both the index and the leveraged fund display long periods of directional trends. The chart may be broken down into 9 periods, as shown in the table below. For each period, we show the returns of the index SPSIBI and those of the leveraged fund, LABU.
| Period | INDEX | LABU |
| 5/28/15 – 7/17/15 | 15.06% | 48.37% |
| 7/17/15 – 2/11/16 | -49.49% | -91.05% |
| 2/11/16 – 6/20/18 | 122.01% | 453.11% |
| 6/20/18 – 12/24/18 | -35.29% | -78.02% |
| 12/24/18 – 3/20/20 | 5.64% | -33.83% |
| 3/20/20 – 2/8/21 | 151.40% | 1005.01% |
| 2/8/21 – 5/11/22 | -63.87% | -97.49% |
| 5/1122 – 10/27/23 | 2.23% | -45.99% |
| 10/27/23 – 12/15/23 | 33.82% | 123.25% |
Observations
- 4 periods when the index made big gains; over those periods, LABU returned more than three times. Extreme example: 3/20/20 – 2/8/21 the ratio was 6.63.
- 3 periods when the index suffered big losses; over those periods, LABU’s losses were harder to recover from. Extreme example: 2/8/21 – 5/11/22
- 2 periods when the index was range bound and made small gains; over those periods, LABU suffered significant losses.
The Biotechnology Index had long periods with extremely large returns. It also had similarly large declines. The leveraged fund amplified those moves. This shows the extreme risk of holding a leveraged fund in a bear market.
Conclusion
I rate LABU as a BUY for the following reasons:
The underlying index and most stocks in its composition are in an uptrend. LABU has a very strong momentum and is outperforming the broad market since October 27. The prevailing market expectations are for the FED to stop raising interest rates and start cutting rates by the summer of 2024.
Risk Warning
LABU, as a leveraged fund, may suffer value erosion and should only be used as a tactical, short-term investment vehicle.
Here is a detailed message from the SEC on the risks inherent in leveraged ETFs.
I have traded LABU a few times over the last few years. I trade based on the chart of the underlying though using XBI. My thought is that the chart of the underlying gives a more accurate picture
mrjustice Investing Group Comments (2.5K)+ Follow You may well be right. But I’ve learned from years of experience that LABU also has a profound ability to turn on a dime and then quickly rake out one’s entrails with it’s strong hind claws. A trailing stop is mandatory because LABU ALWAYS wants to head back down towards zero in the long run. It started its march downward from a reverse-split adjusted high of about 4800 back in 2016.Biotech, Pharma, Short, Inverse and commodity related leveraged ETFs are notorious for leading the eager trend follower out to the deep water, climbing on his head and then laugh at all the bubbles as they push him to the bottom…..never to come back up.As the Las Vegas dealer said to Chevy Chase, when he was trying to gamble his way back into the green…”Why don’t we two just split your money between us and I’ll take you out back and kick you in the b@lls instead?”My choice here would be TQQQ, TECL, SPXL or SOXL for the same reasons the author lists…and the addition of a far greater margin of safety.
- The Direxion Daily S&P Biotech Bull and Bear 3X Shares (LABU) provides 3x daily exposure to a biotechnology index.
- Levered ETFs like LABU are designed for short-term trading and may suffer tracking errors from positive convexity and volatility decay.
- LABU can be used as a swing trading tool for experienced traders, taking advantage of positive convexity and macro tailwinds in biotech stocks.
Levered ETFs Only Designed To Work On Short Time Horizons
It is important to remember levered ETFs have ‘positive convexity’ in the direction of its bet (i.e. the exposure grows as the bet is winning), and it loses value from ‘volatility decay’.
Levered Long ETFs As Swing Trading Instruments
However, levered ETFs are not necessarily bad investments. They can be useful tools for sophisticated investors. Some swing traders like to use levered long ETFs like LABU precisely because of its positive convexity. For example, from its recent October 27th lows of 4,991, the underlying index is up 23.8% (Figure 2).
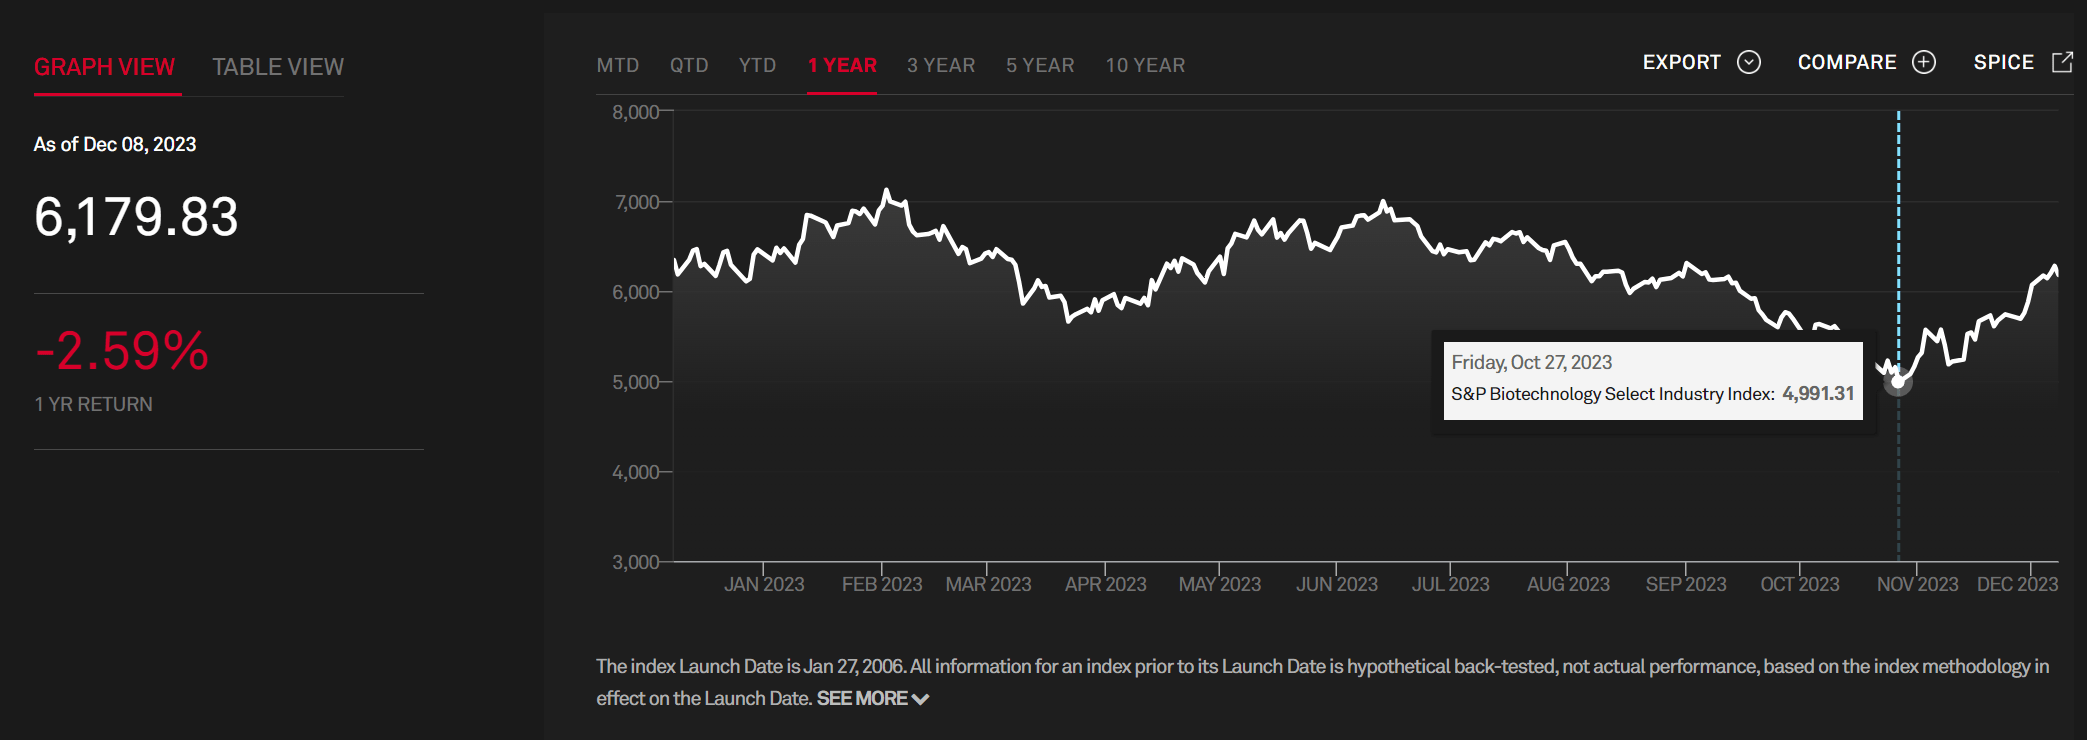
Figure 2 – S&P Biotechnology Select Industry Index returns (spglobal.com)
However, the LABU ETF, in contrast, has returned 78.7%, more than three times the underlying 23.8% return (Figure 3). This difference is due to the positive convexity mentioned above.
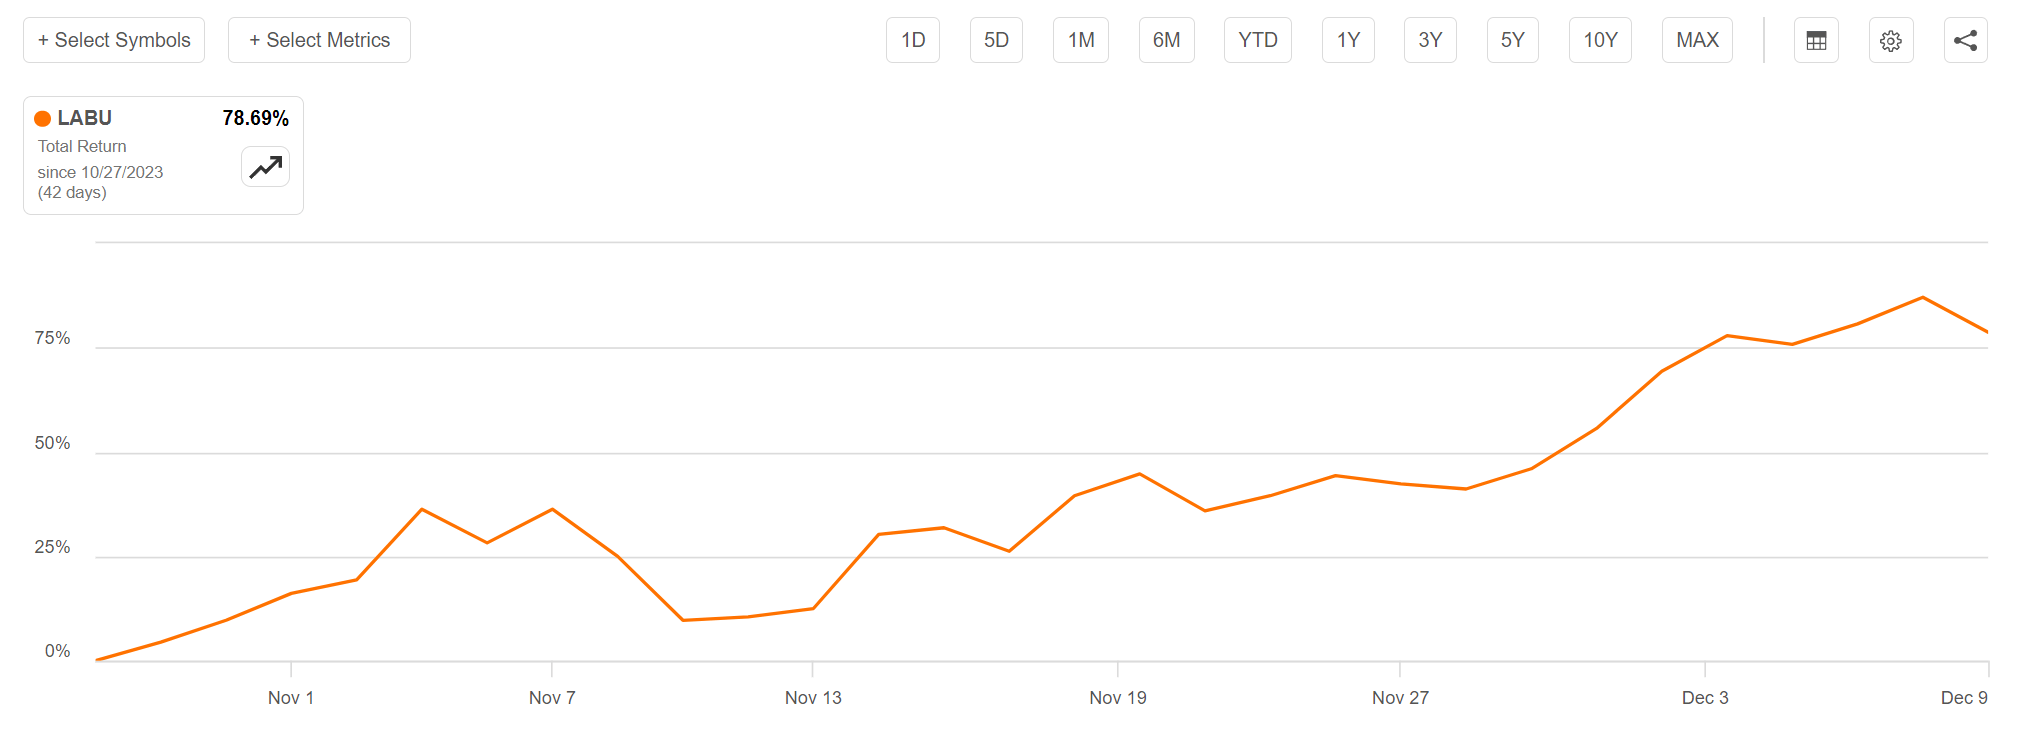
Figure 3 – LABU has returned more than 3x underlying returns since October 27th low (Seeking Alpha)
In extreme circumstances when the underlying index rallies mostly one-way for a long period of time, levered ETFs like LABU can deliver truly extraordinary returns.
From its COVID lows of 5,142 on March 18, 2020, the S&P Biotechnology Select Industry Index gained 163% to 13,513 on February 8, 2021. However, due to positive convexity and the minimal drawdowns, the LABU ETF gained an incredible 1,147% (Figure 4)!
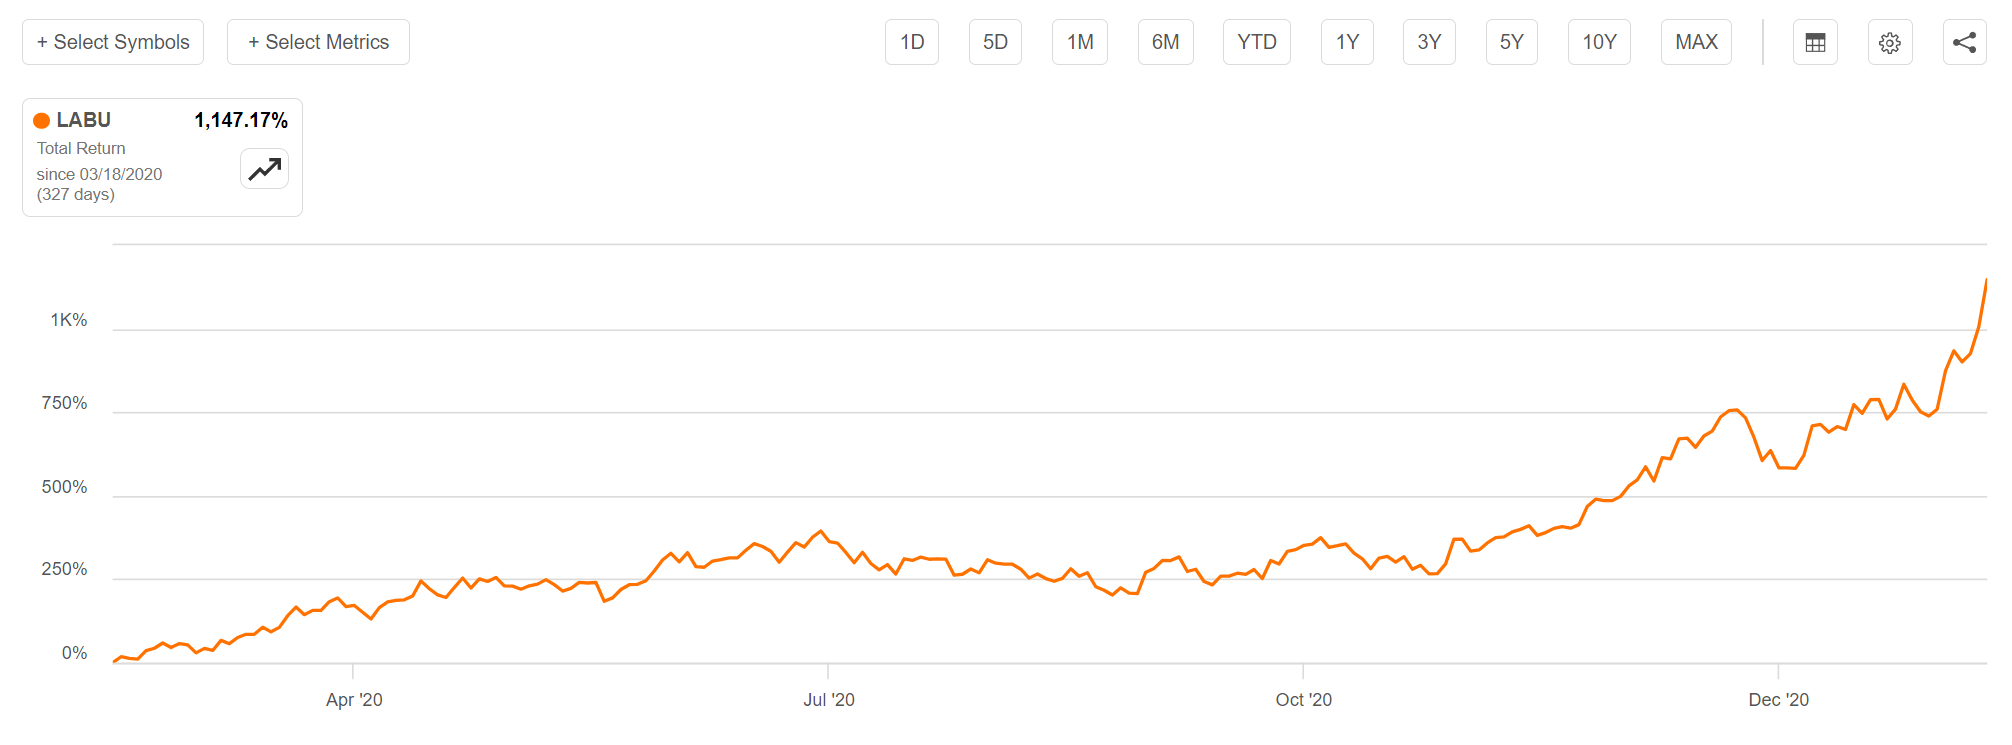
Figure 4 – LABU returned more than 11x from March 2020 to February 2021 (Seeking Alpha)
The challenge, of course, is to figure out when to enter these swing trades and when to take profits, as the position size can grow very quickly, and if profits are not taken along the way, they can disappear just as quickly on pullbacks because drawdowns are magnified by the leverage.
For example, even though the LABU ETF returned more than 11x from March 2020 to February 2021, if investors had bought at the absolute COVID lows from March 18, 2020 and held until today, they would still have lost almost 70% of their capital (Figure 5).
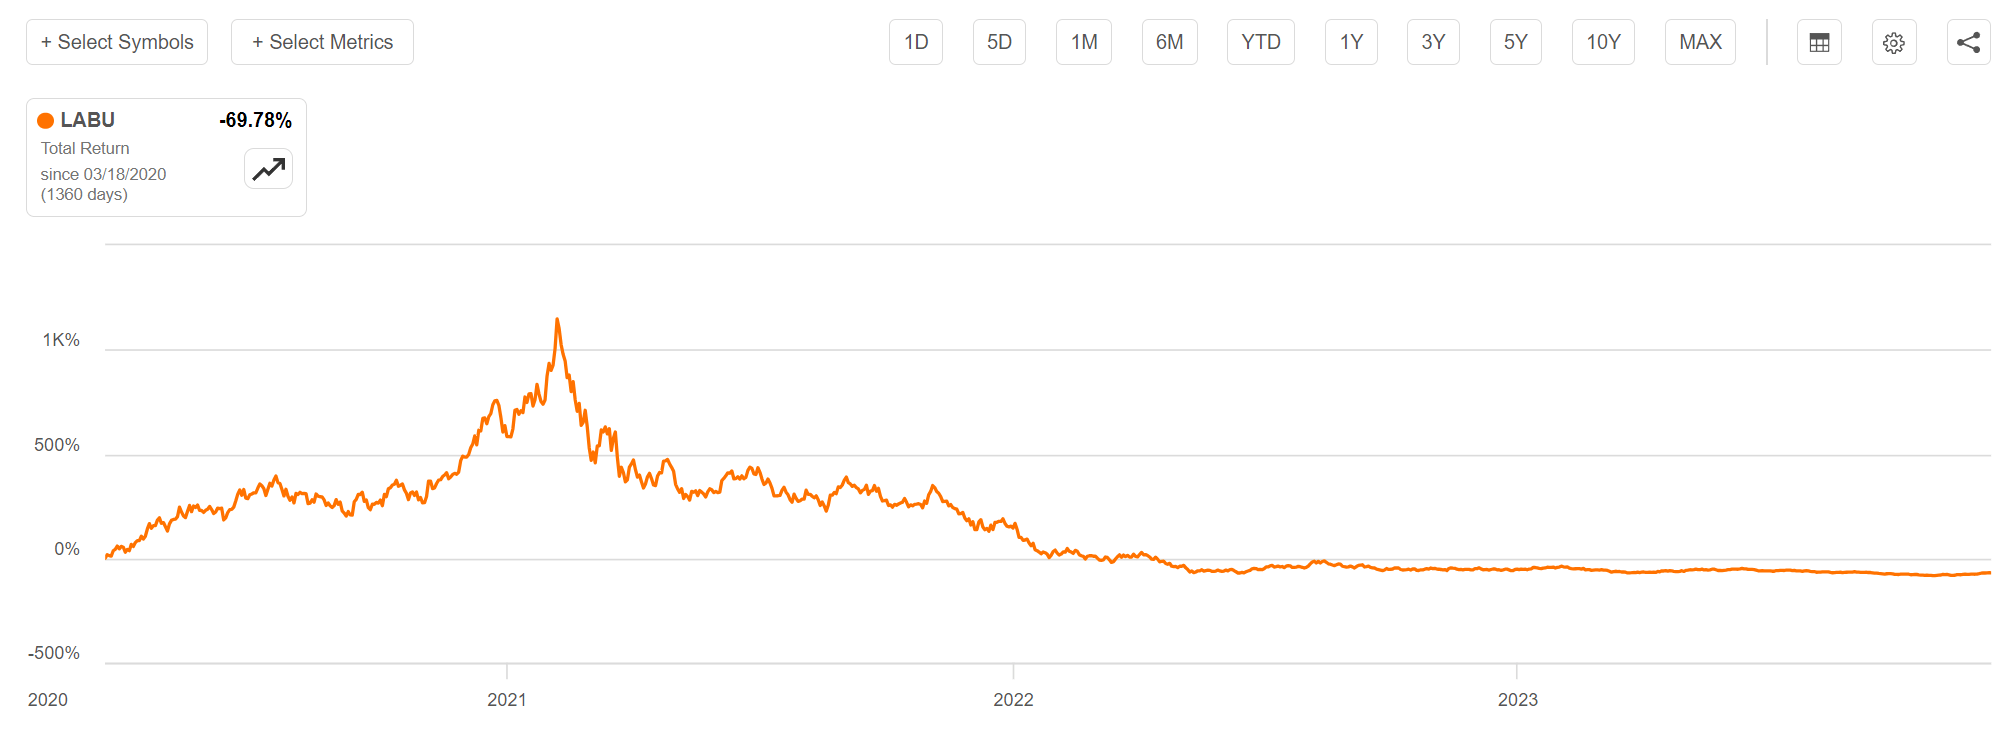
Figure 5 – However, LABU is down 70% when measured from COVID lows (Seeking Alpha)
Focus On Developing A Trading System Before Considering Leverage
Before investors venture into levered ETFs in search for treasure, they should have a consistent trading system/strategy that can deliver profits on unlevered assets. The leverage from levered ETFs like LABU is a tool that only enhances the underlying trading returns, be it positive or negative.
Loosening Financial Conditions A Tailwind For Biotech
Biotech companies are usually pre-revenue hyper-growth companies and are dependent on well-functioning capital markets and loose risk-appetites to finance their operations. When financial conditions tighten, equity financing becomes scarce and biotech stocks tend suffer. We can see this relationship graphically by overlaying the SPDR S&P Biotech ETF (XBI) against the Chicago Fed’s National Financial Conditions Index. When financial conditions tightened like they did in 2008-9, 2011, 2015-2016, 2020, and more recently, biotech stocks usually struggle (Figure 6).
Figure 6 – Biotech stocks suffer when financial conditions tighten (Author created with price chart from stockcharts.com and data from Chicago Fed)
More recently, despite the Fed claiming to tighten monetary policies to combat inflation, financial conditions have actually been gradually loosening, with November 2023 readings back to early 2022 levels.
Loosening financial conditions is reigniting animal spirits, as seen from the recent rally of cryptocurrencies to speculative stocks like biotech. As long as financial conditions remain loose, biotech stocks should have a tailwind.
- 12/23/2023 – How to Ride the Biotech Roller Coaster – WSJ The biotech sector is rallying once again, but picking the winners is anything but easy
With stocks starting to price in interest-rate cuts next year, the biotech sector has emerged as a winner for investors seeking riskier bets with more distant payoffs.
But investing in this industry is tricky because biotech is a sector of haves and have-nots. While every industry has its winners and losers, the gap in biotech is bigger due to the binary nature of drug development. Many companies spend years testing one medical approach or platform. In the end, either the idea works or it doesn’t, and that could be the difference between tripling your investment or losing it all.
Because of that dichotomy, being able to weed out the losers (or actively bet against them) is especially important for fund managers. Index funds generally serve investors well in other sectors, but the argument for active management is stronger in a category with such a wide dispersion of outcomes. An analysis by asset-management firm Janus Henderson demonstrates that the disparity of average annual returns by sector over the past decade was highest among healthcare by far, with biotech leading the way.
Fund performance in the past decade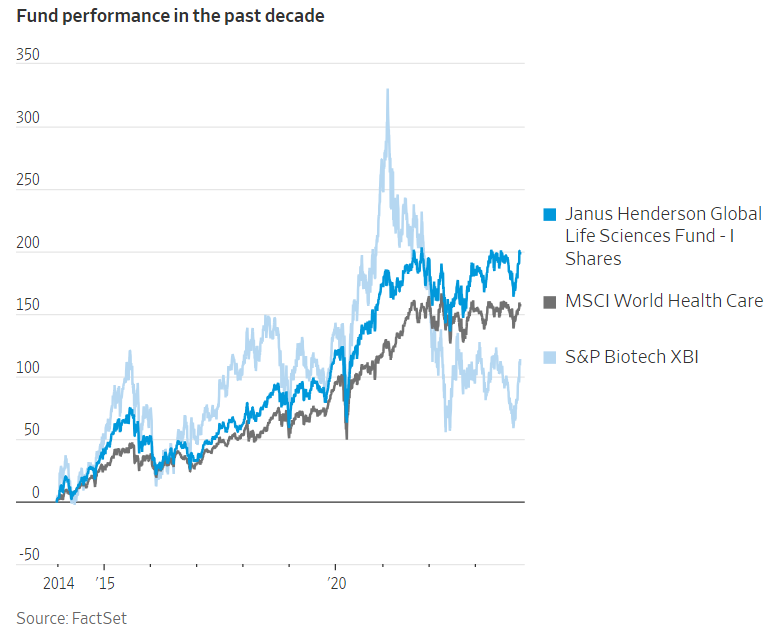
For example, the gap in returns between the top five and bottom five in biotech was more than four times that of the software industry, with the top five biotechs returning 287% versus a loss of 78% for the bottom five. In the software industry, by contrast, the top gainers returned 140% versus a 46% loss for the bottom five.
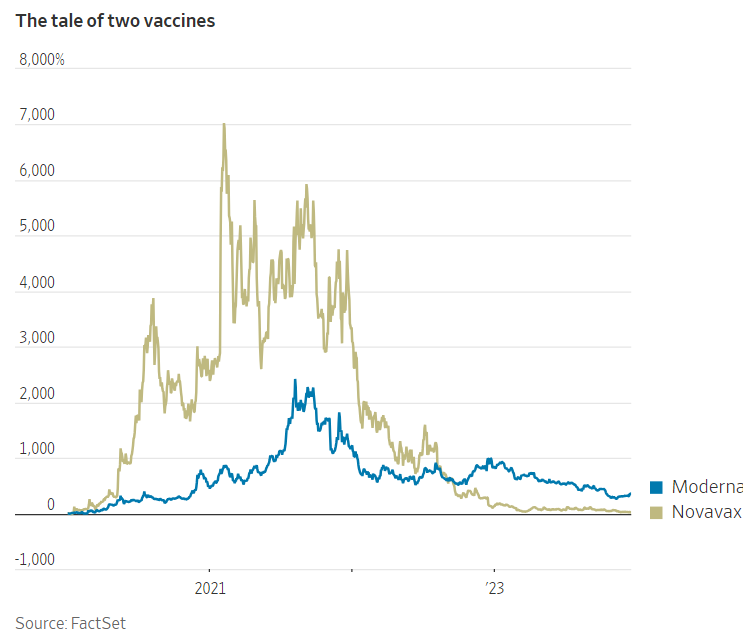
The race to develop an effective Covid-19 vaccine helps illustrate the winner-take-all nature of the industry. In 2020 and early 2021, Moderna and Novavax, two vaccine developers, took off, adding billions of dollars to their respective market capitalizations. But investors who bought into those stocks at, say, the start of 2020, had very different results from each company three years later. While Moderna has come tumbling down from its 2021 peak, it has still more than quadrupled in value since early 2020, thanks to the commercial success of its mRNA vaccine. Novavax, whose vaccine hasn’t made nearly as much headway, gave back nearly all of its astronomical pandemic gains.
The difficulty in picking winners stems from the “90/90” rule, explain Janus Henderson portfolio managers Andy Acker and Daniel Lyons. According to their estimates, 90% of drugs that enter human clinical trials fail to achieve approval, and for the 10% of drugs that do get approval, consensus sales estimates tend to be wrong 90% of the time. As an example, they point to Horizon Therapeutics, which was acquired by Amgen this year for nearly $28 billion.
At the end of 2019, the company was forecasting that its thyroid eye-disease drug Tepezza would reach full-year sales of about $35 million in 2020. Wall Street consensus estimates were similar. In the end, the drug did over $800 million in sales for the year.
In a sector with so many losers and a few top performers, Acker argues that it pays to have a team of people who can more accurately assess the clinical and commercial risks of drug development. “In biotech, you don’t have to be perfect, but if you’re right more often than consensus, that can add value consistently over time,” he says. “In this industry, if you’re right 60% of the time, you’re going to have a good career. And if you’re right 70% of the time, you’re a rock star.”