The Dow Jones index ended the year 2011 with 5.5% up, S&P 500 index completed less than 1% below its 2010 close, and Nasdaq finished with 1.8% depressed. Overall, U.S. equities closed on a very volatile year largely driven by Europe’s sovereign debt crisis.
What was the economic picture in the United States in 2011? Let us answer this question by looking at the Federal data of the most significant 9 key economic indicators:
- GDP and GDP quarterly growth rate
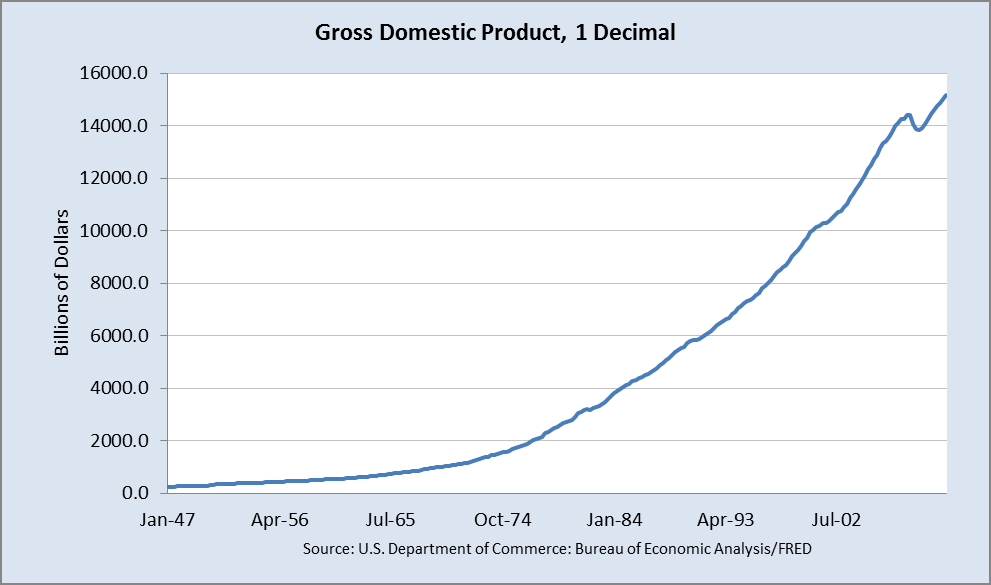
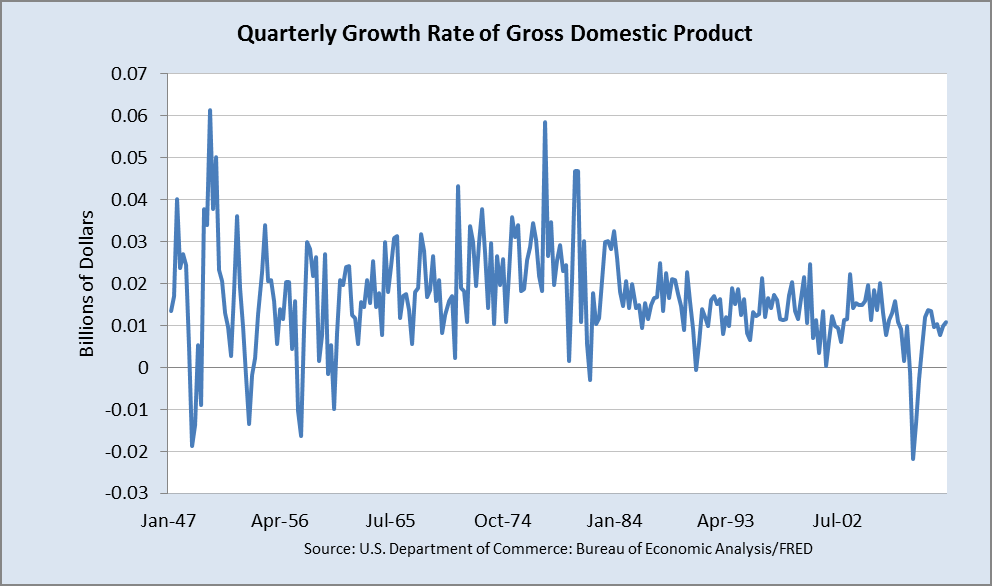
It is the main indicator that reflects the state of the US national economy. GDP = C + I + S + (E – M), where C – consumption, I – investment, S – public expenditure, E – Exports, M – imports. Its impact on the market is significant.
The GDP obviously increases steadily even though the quarterly growth rate is low – a little over 1% on 2011. Compared with the negative growth rate of 2009, the growth rate of 2011 is much better and the upward trend is somewhat noticeable.
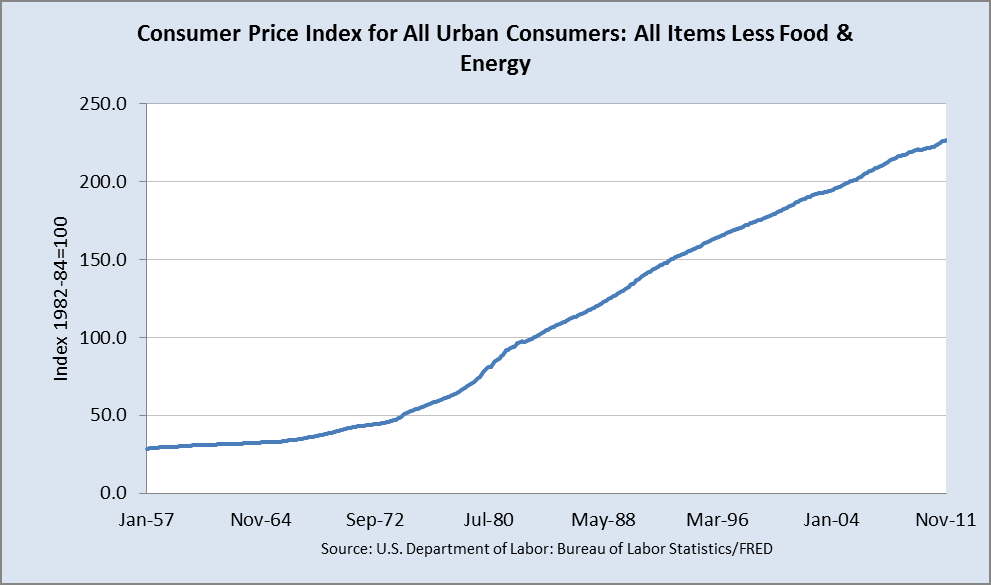
2. Consumer Price Index for All Urban Consumers: All Items Less Food & Energy
It represents changes in the level of retail prices for the basic consumer basket. This is the main indicator of inflation. The slope of the above curve indicates the growth rate of retail prices. Evidently, there is no abrupt jump of slope in 2011 which suggests that inflation is well under controlled.
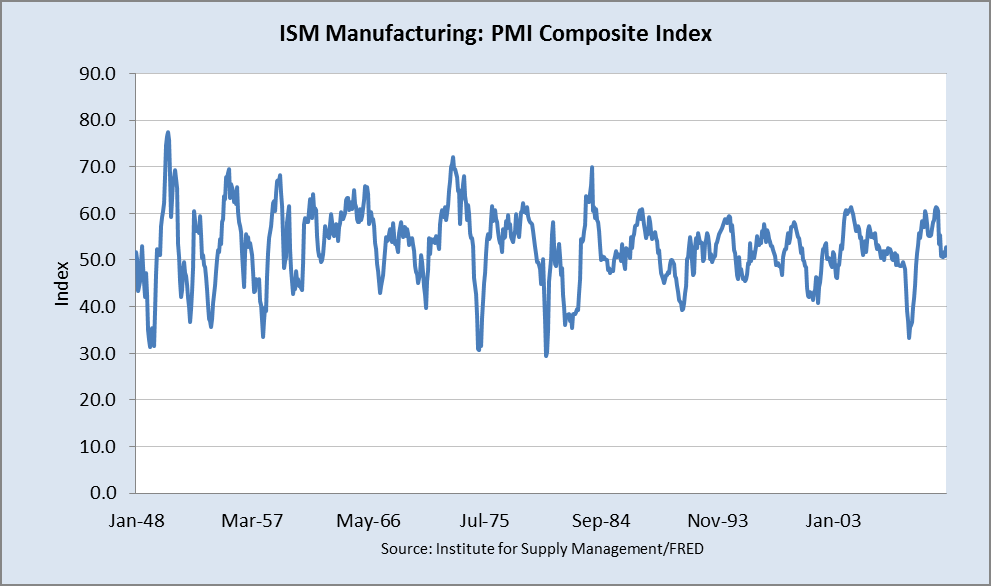
3. ISM Manufacturing: PMI Composite Index
The indicator represents the results of a survey of purchasing managers in the industry and the status of production orders, prices of products and inventories in warehouses. The value below 50 indicates a slowdown in the economy and an increase in economic activity in the region if its value exceeds 50. This index has a high impact on the market.
The index in 2011 is a little over 50 which suggests mild growth of economy.
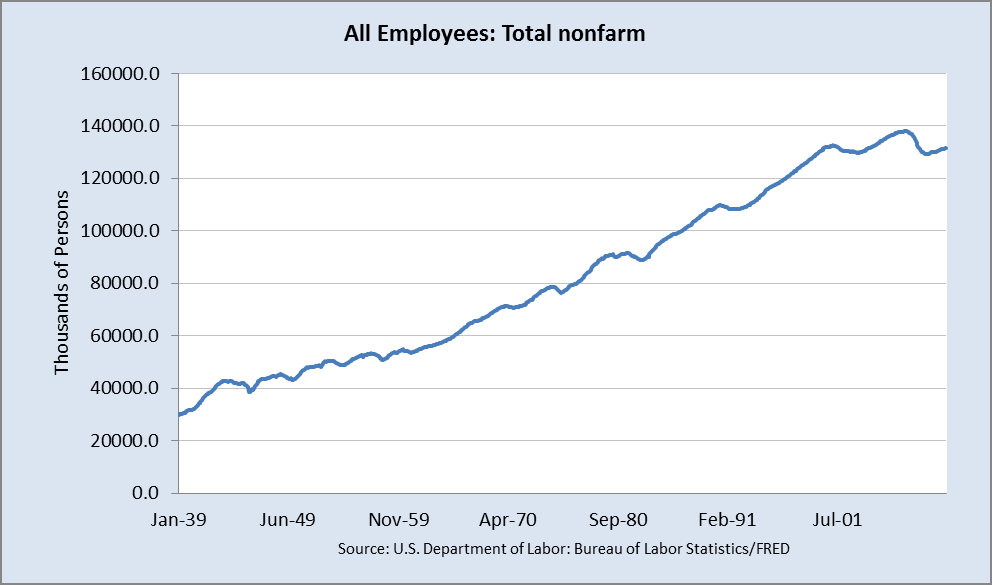
4. All Employees: Total nonfarm
Nonfarm payrolls indicator is a very strong indicator that shows the change in the level of employment in the country. The growth of this indicator reflects an increase in employment and leads to an increase in USD. It is called the indicator which moves the markets.
The above figure shows that after the slump of Nonfarm payrolls in 2009, they are constantly picking up in 2011. The slightly upward trend is obvious
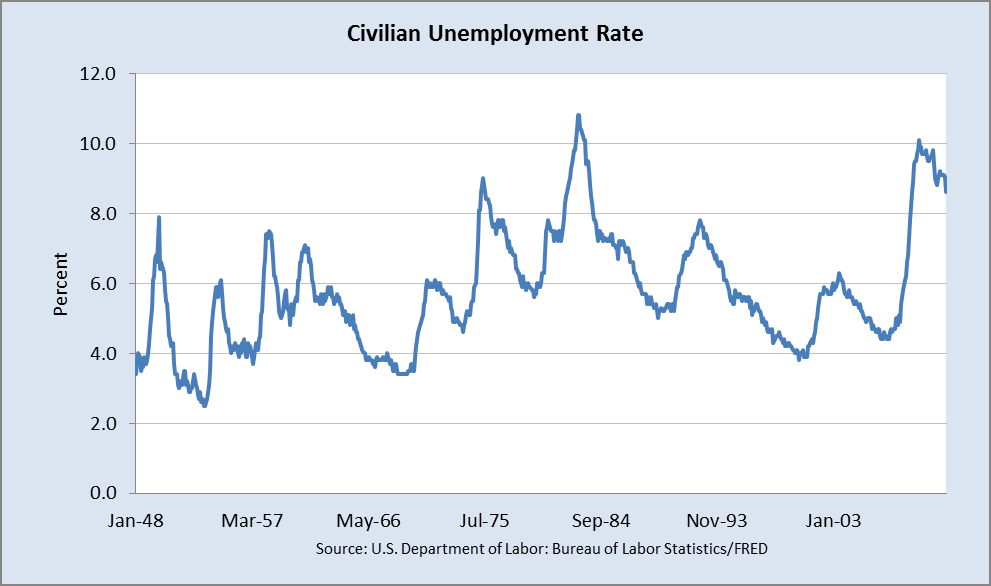
5. Civilian Unemployment Rate
This indicator shows changes in the number of weekly applications for unemployment benefits. This indicator represents the number of the registered unemployed. These
figures do not always reflect the real picture of events. They are distorted by short-term factors from time to time, such as state or local holidays. It has a limited impact on the market.
From 2009 to 2011, the rate decreases from 10% to 8.9% nowadays. The downward trend
is noticeable even though the rate is still quite higher than the historical average.
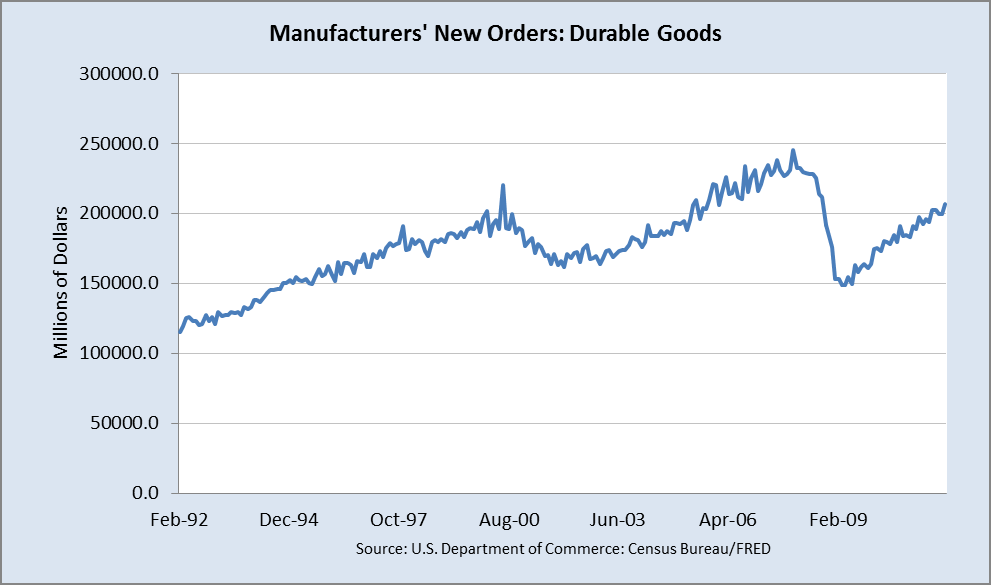
6. Manufacturers’ New Orders: Durable Goods
The indicator is based on a monthly review of 5000 manufacturers, including statistics on production orders of durable goods. Durable goods include products with a lifetime of more than three years, such as cars, furniture, etc. In order to highlight the variability which typical for military and transportation orders, there durable goods orders excluding defense and durable goods orders excluding transportation. This is an important indicator for the market because it provides an indication of the confidence of consumers of these products in the current economic situation. As durable goods are quite expensive, an
increase in the number of orders shows the willingness of consumers to spend
their own money. Thus, the growth of this indicator is a positive factor for
economic development and leads to an increase in the national currency.
The uptrend of this indicator from 2009 to 2011 is very clear which suggests
organic growth in US.
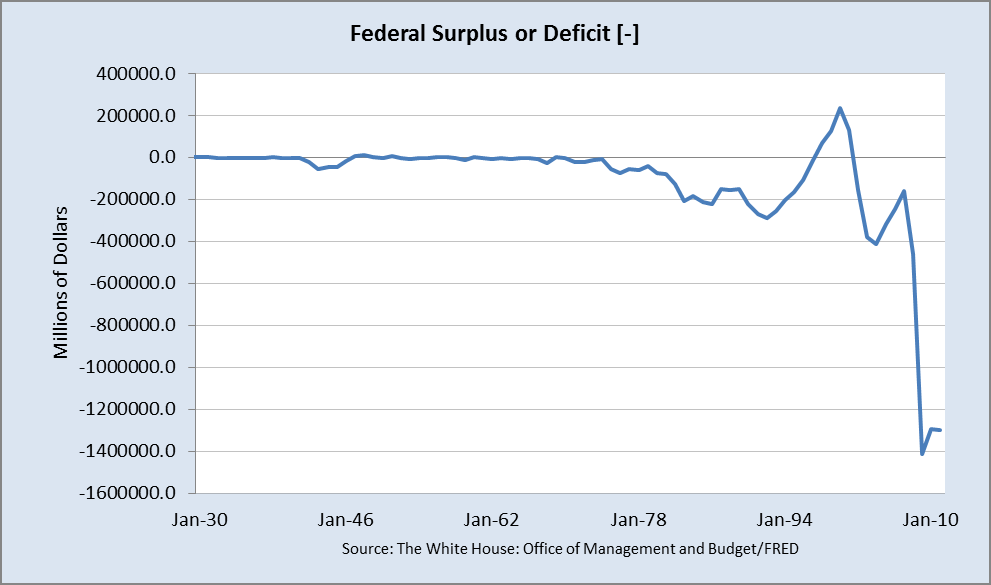
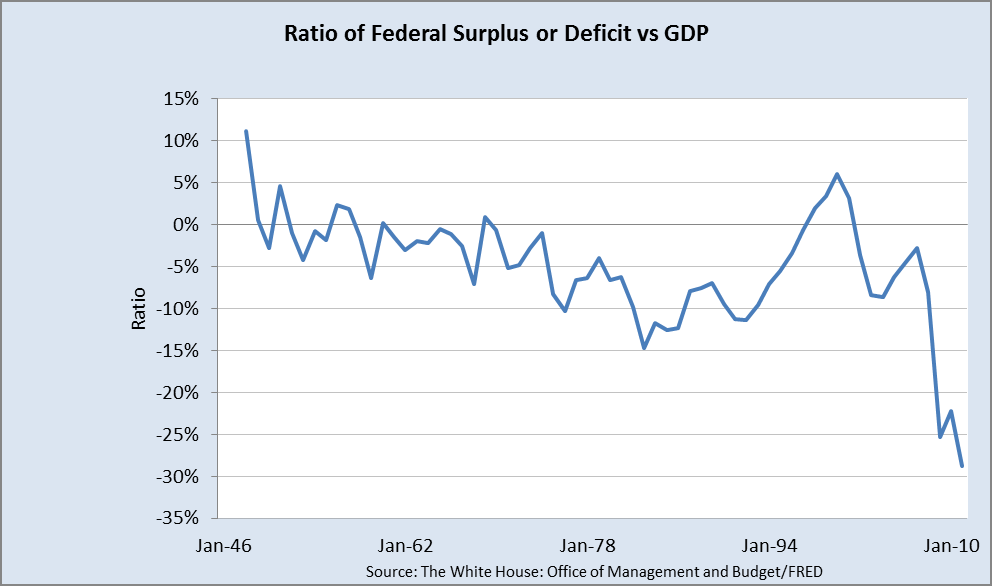
7. Federal Surplus or Deficit
Federal surplus or deficit characterizes the ratio between income and expenditure of
the state. When the level of government income is more (less) than spendings, then there is surplus (deficit). This rate has a negligible impact on the market. Usually it is used for a long-term economic analysis and forecast of the exchange rate of the currency. The budget deficit leads to an increase in public debt and may be a catalyst for acceleration of inflation.
The current Federal deficit is at historically high and it is approaching 30% of GDP. The shoot up of public debt will definitely put a significant burden on the economic growth and that is also why US credit rate was downgraded in 2011. Fortunately, in the current short run, the interest rate is very low, and the deflation is well under controlled, so the debt burden is not imminent significant. In the long run, however, the US policy makers have to figure out viable strategies to curb the runaway of national debt, otherwise, US might repeat the story of PIIGS. The future of US economic is still looming.
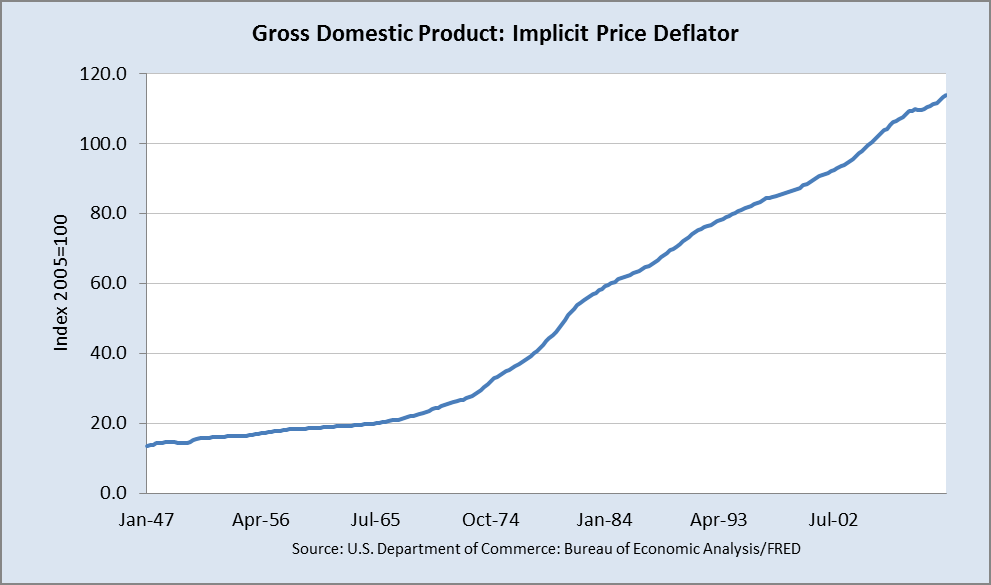
8. Gross Domestic Product: Implicit Price Deflator
The GDP deflator is an analogue of the consumer price index (CPI) and shows a change in
the price levels of all goods belonging to GDP. Unlike the consumer price index, GDP deflator is not measured on a fixed basket of goods but on the current structure of production. The GDP deflator has a significant impact on the market.
Growth of GDP deflator usually leads to an increase in the national currency as well
as interest rates. Since the current interest rate is at historically low, the growth of GDP deflator only affects relative strong growth of USD.
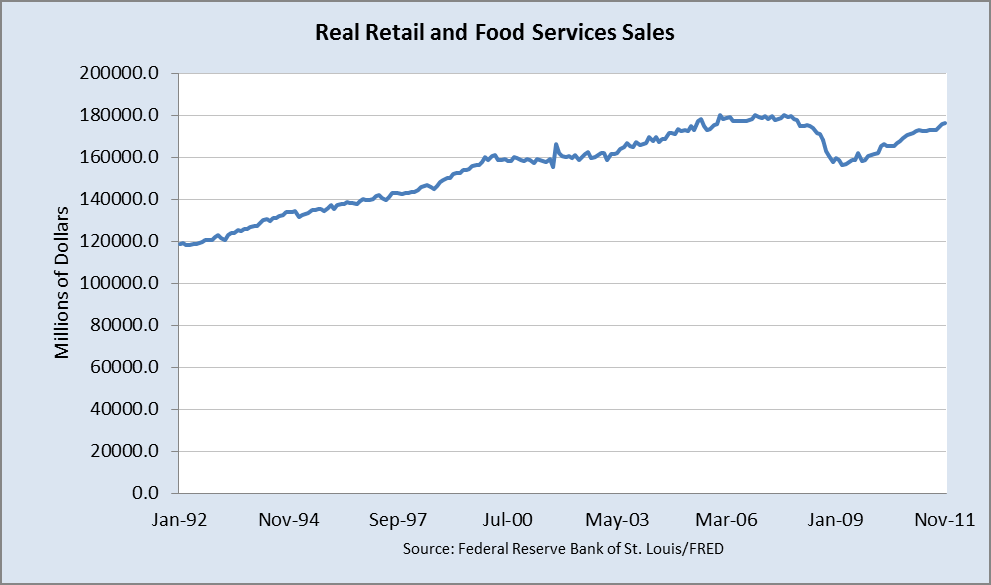
9. Real Retail and Food Services Sales
The index shows the change in the volume of sales in the retail trade. It characterizes the
level of consumer spending and demand. The growth of retail sales is a positive
factor for the development of the national economy and leads to an increase in
the national currency.
The sales data in 2011 is approaching historical high (2007) which will definitely fuel the continuous growth of economy.
In sum, the economic picture of US in 2011 is not mire, as reflected in the depressed and volatile stock market, but a bit bright and promising when we marching into year 2012.

3 Responses to Retrospect of US economy in 2011